China is Literally a Copy of the United States!
For every dollar of additional debt less GDP comes back in return.
There's a common misconception among investors that because China has adopted a different financial and societal system than the United States, the two countries must be fundamentally different. But this couldn't be further from the truth. Both nations are grappling with faltering economic engines that are being kept alive by the same mechanism: debt.
Bang for Your Buck
The chart below, created by James Eagle (
) (based on an original by Goldman Sachs, but far better looking), has been making waves on both traditional and social media lately. It shows, at a glance, how the debt intensity of the United States has skyrocketed. Until the 1970s, every dollar of debt injected into the economy yielded between four and eight dollars of economic growth (nominal GDP). Today, that figure has plummeted to a meager 58 cents.In other words, for every dollar of government debt added to the U.S. economy, you get just over half a dollar back in GDP growth. This begs a fundamental question: will debt levels continue to balloon? The answer is unequivocally 'YES.' Unless we abandon growth as a goal, more debt will be necessary to sustain it.
Copy-Paste
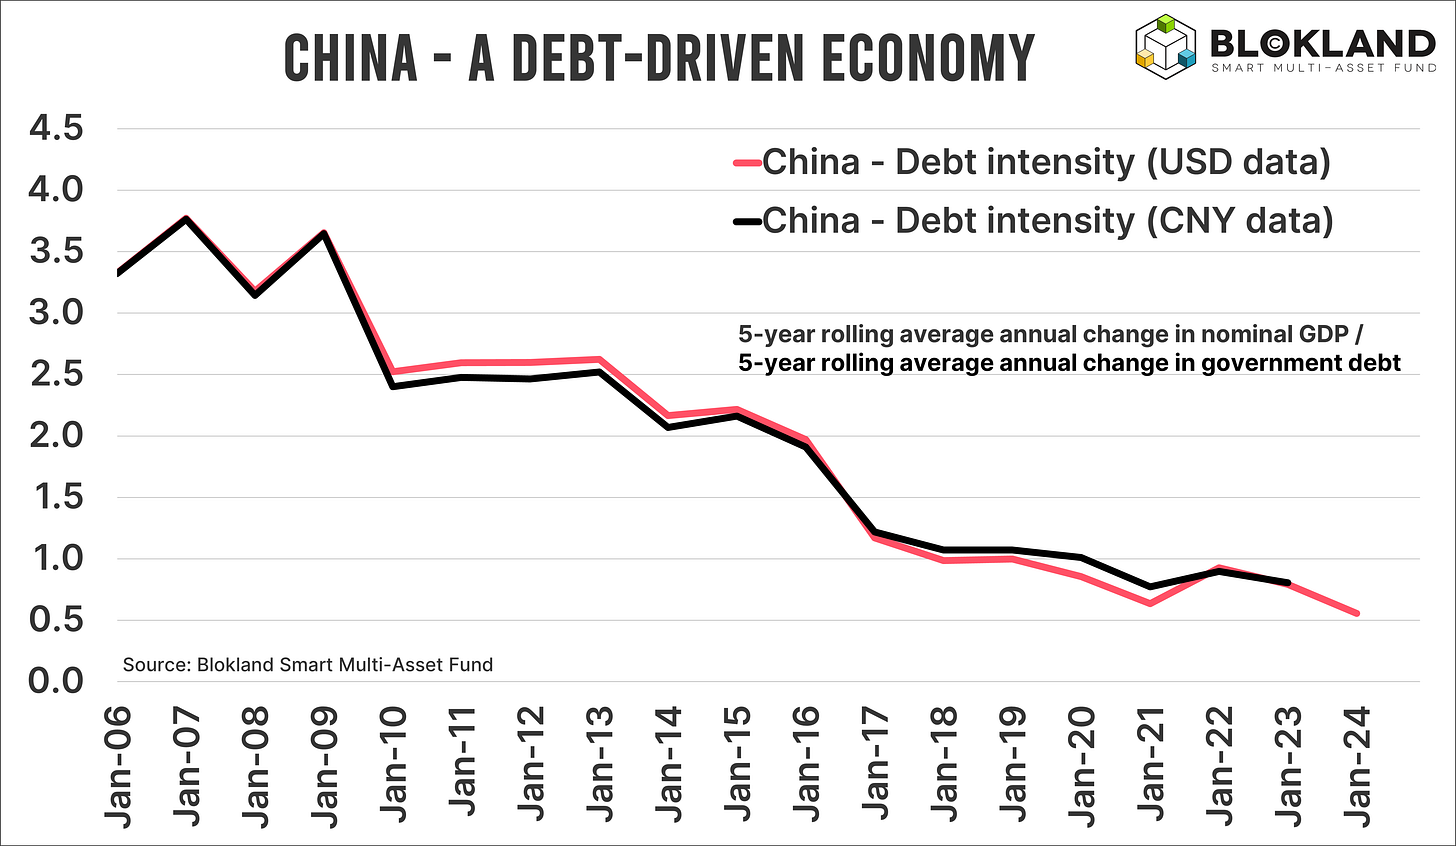
This data-backed conclusion should make any investor rethink their portfolio strategy. But there's more. Debt proponents often argue that the U.S. is a special case, with U.S. debt serving as the ultimate form of collateral. But let's shift our focus across the Pacific to China. Creating a similar debt intensity chart for China is not difficult, so I did just that using the same methodology as Goldman Sachs. And since much of the available data from China comes in dollar terms, I used both USD and CNY figures.
The results, while unsurprising, are nonetheless striking. Based on USD data (CNY data for 2023 isn't available yet), China's debt intensity stands at 0.56, almost identical to the U.S. figure of 0.58. While I couldn't go as far back as the 1950s due to limited Chinese data, the trend perfectly mirrors that of the U.S.
Do Something With It
China, whose working population is projected to shrink at an alarming rate in the coming decades, is as much a debt-driven economy as any other major player in the global financial system.
This has critical implications for bond investors. The need to keep interest rates in China structurally low is obvious: more debt is required to sustain economic growth. Do you think President Xi Jinping will ever abandon the pursuit of growth? The likelihood is virtually zero, especially as China seeks to outmaneuver Europe economically—a goal the Europeans seem more than willing to accommodate. And the recent slew of liquidity measures is another excellent example of this.
Lower interest rates, growing concerns over debt sustainability, increasing central bank interventions, and higher, unpredictable inflation are all factors that make bonds a less-than-appealing investment in today's investment portfolio.
Most of you will know what I did with that: I launched the Blokland Smart Multi-Asset Fund, which invests in scarce assets only. Its substack can be found here!
Thank you for reading!
Jeroen Blokland


Hello, Jeroen,
Last month, I published the heatmap 'G20 GDP Expansion per Unit of Debt'. The US is in bad shape, but not the worst as Japan. Italy and France are also bad. China, Brazil, and India have significantly deteriorated during the period. Russia shows the best performance.
My original publication is here
https://public.tableau.com/app/profile/nikita.kalinin/viz/G19GDPExpansionperUnitofDebt/Dashboard