


Do Smart and Dumb Money Exist? If so, What Do They Tell Us?
I look at two measures of investor sentiment and the totally opposite signals they are giving

Some restraint is in order to classify retail and institutional investors as 'dumb' and 'smart' money. Each year, several large hedge funds announce they must close shop because their bets did not quite turn out as anticipated. Nevertheless, the views and positioning of both investor groups hold valuable information about the direction of markets. Curiously, at present, they are sending completely opposite signals. This post highlights why you should follow the views of these two investor types to get a better picture of market sentiment and how they help you determine the market's direction. Moreover, all data in this analysis is freely available.
Extreme optimism among American retail investors
The net percentage of bulls, the difference between the percentage of bulls and bears, in the American Association of Individual Investors, or AAII, Investment Sentiment Survey, has reached extreme levels. After being almost consistently negative for a year and a half, American retail investors have caved to the rally and are now massively bullish.
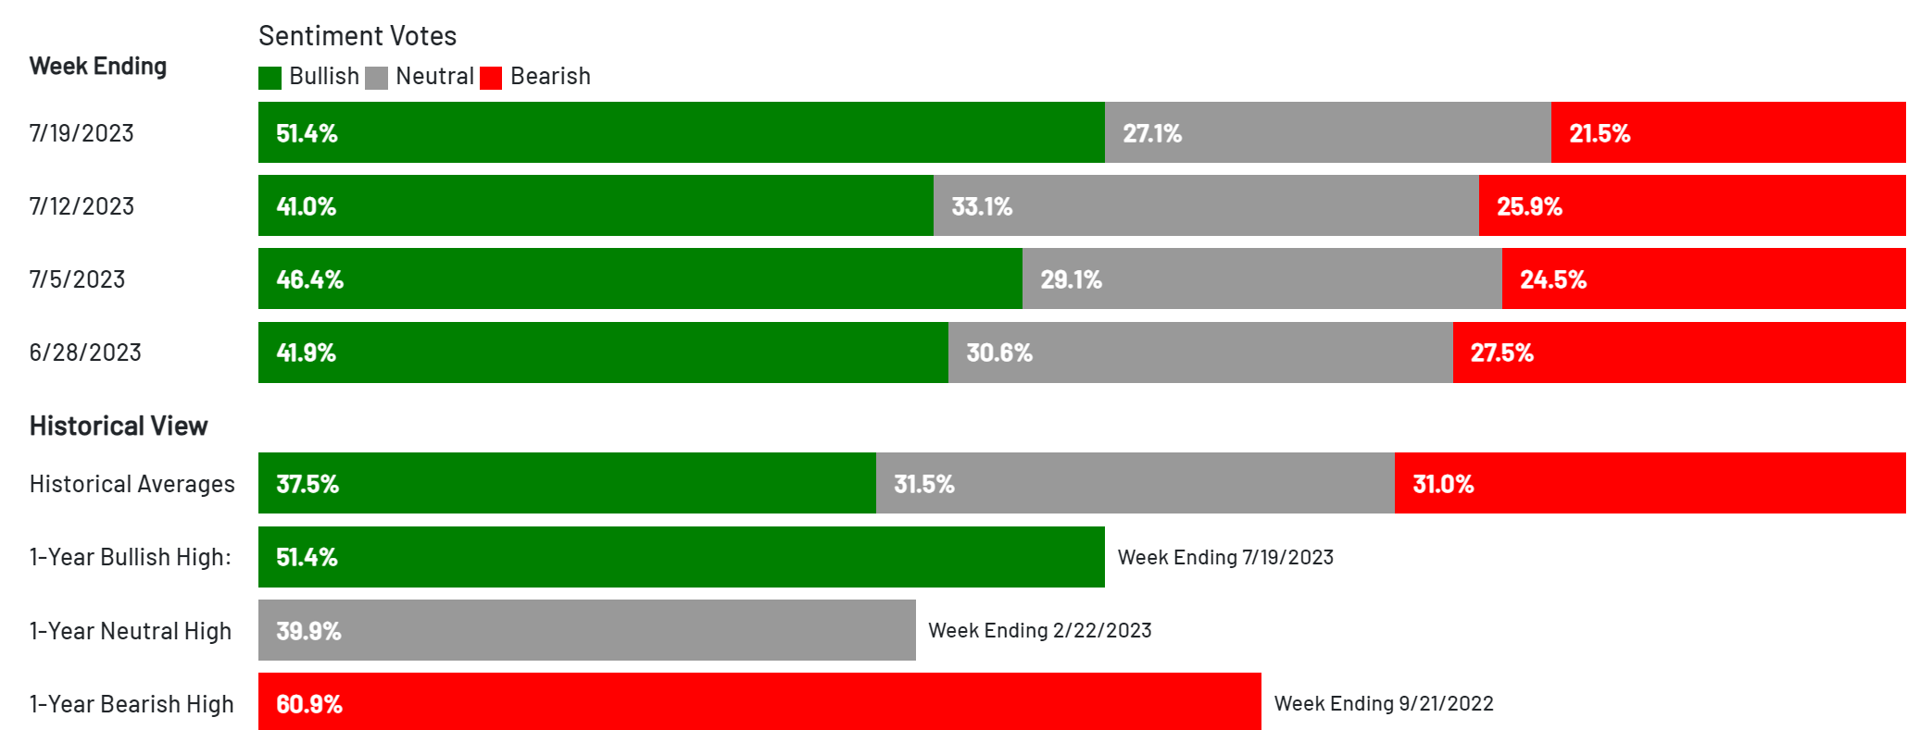
The latest AAII survey revealed that as much as 51.4% of the surveyed investors are bullish compared to 21.5% bears. This results in a percentage of net bulls of 29.9%, which is extreme from a historical perspective. However, this is an extremely good reason to be negative on stocks.
In the graph below, I have calculated the average 3-month return on the S&P 500 Index after American retail investors became extremely bullish and bearish. Bullish retail investors do not bode well for US stocks. On average, the S&P 500 Index fell by 1.4% three months after retail investors became extremely bullish. The 1.4% returns should be compared to the average return on stocks measured over all three-month periods, which is just under 2%. Hence, US stocks underperform the long-term average by more than 3% when retail investors are extremely bullish. When US retail investors became extremely bearish, the future 3-month return on the S&P 500 Index has been above average (4.4%.)
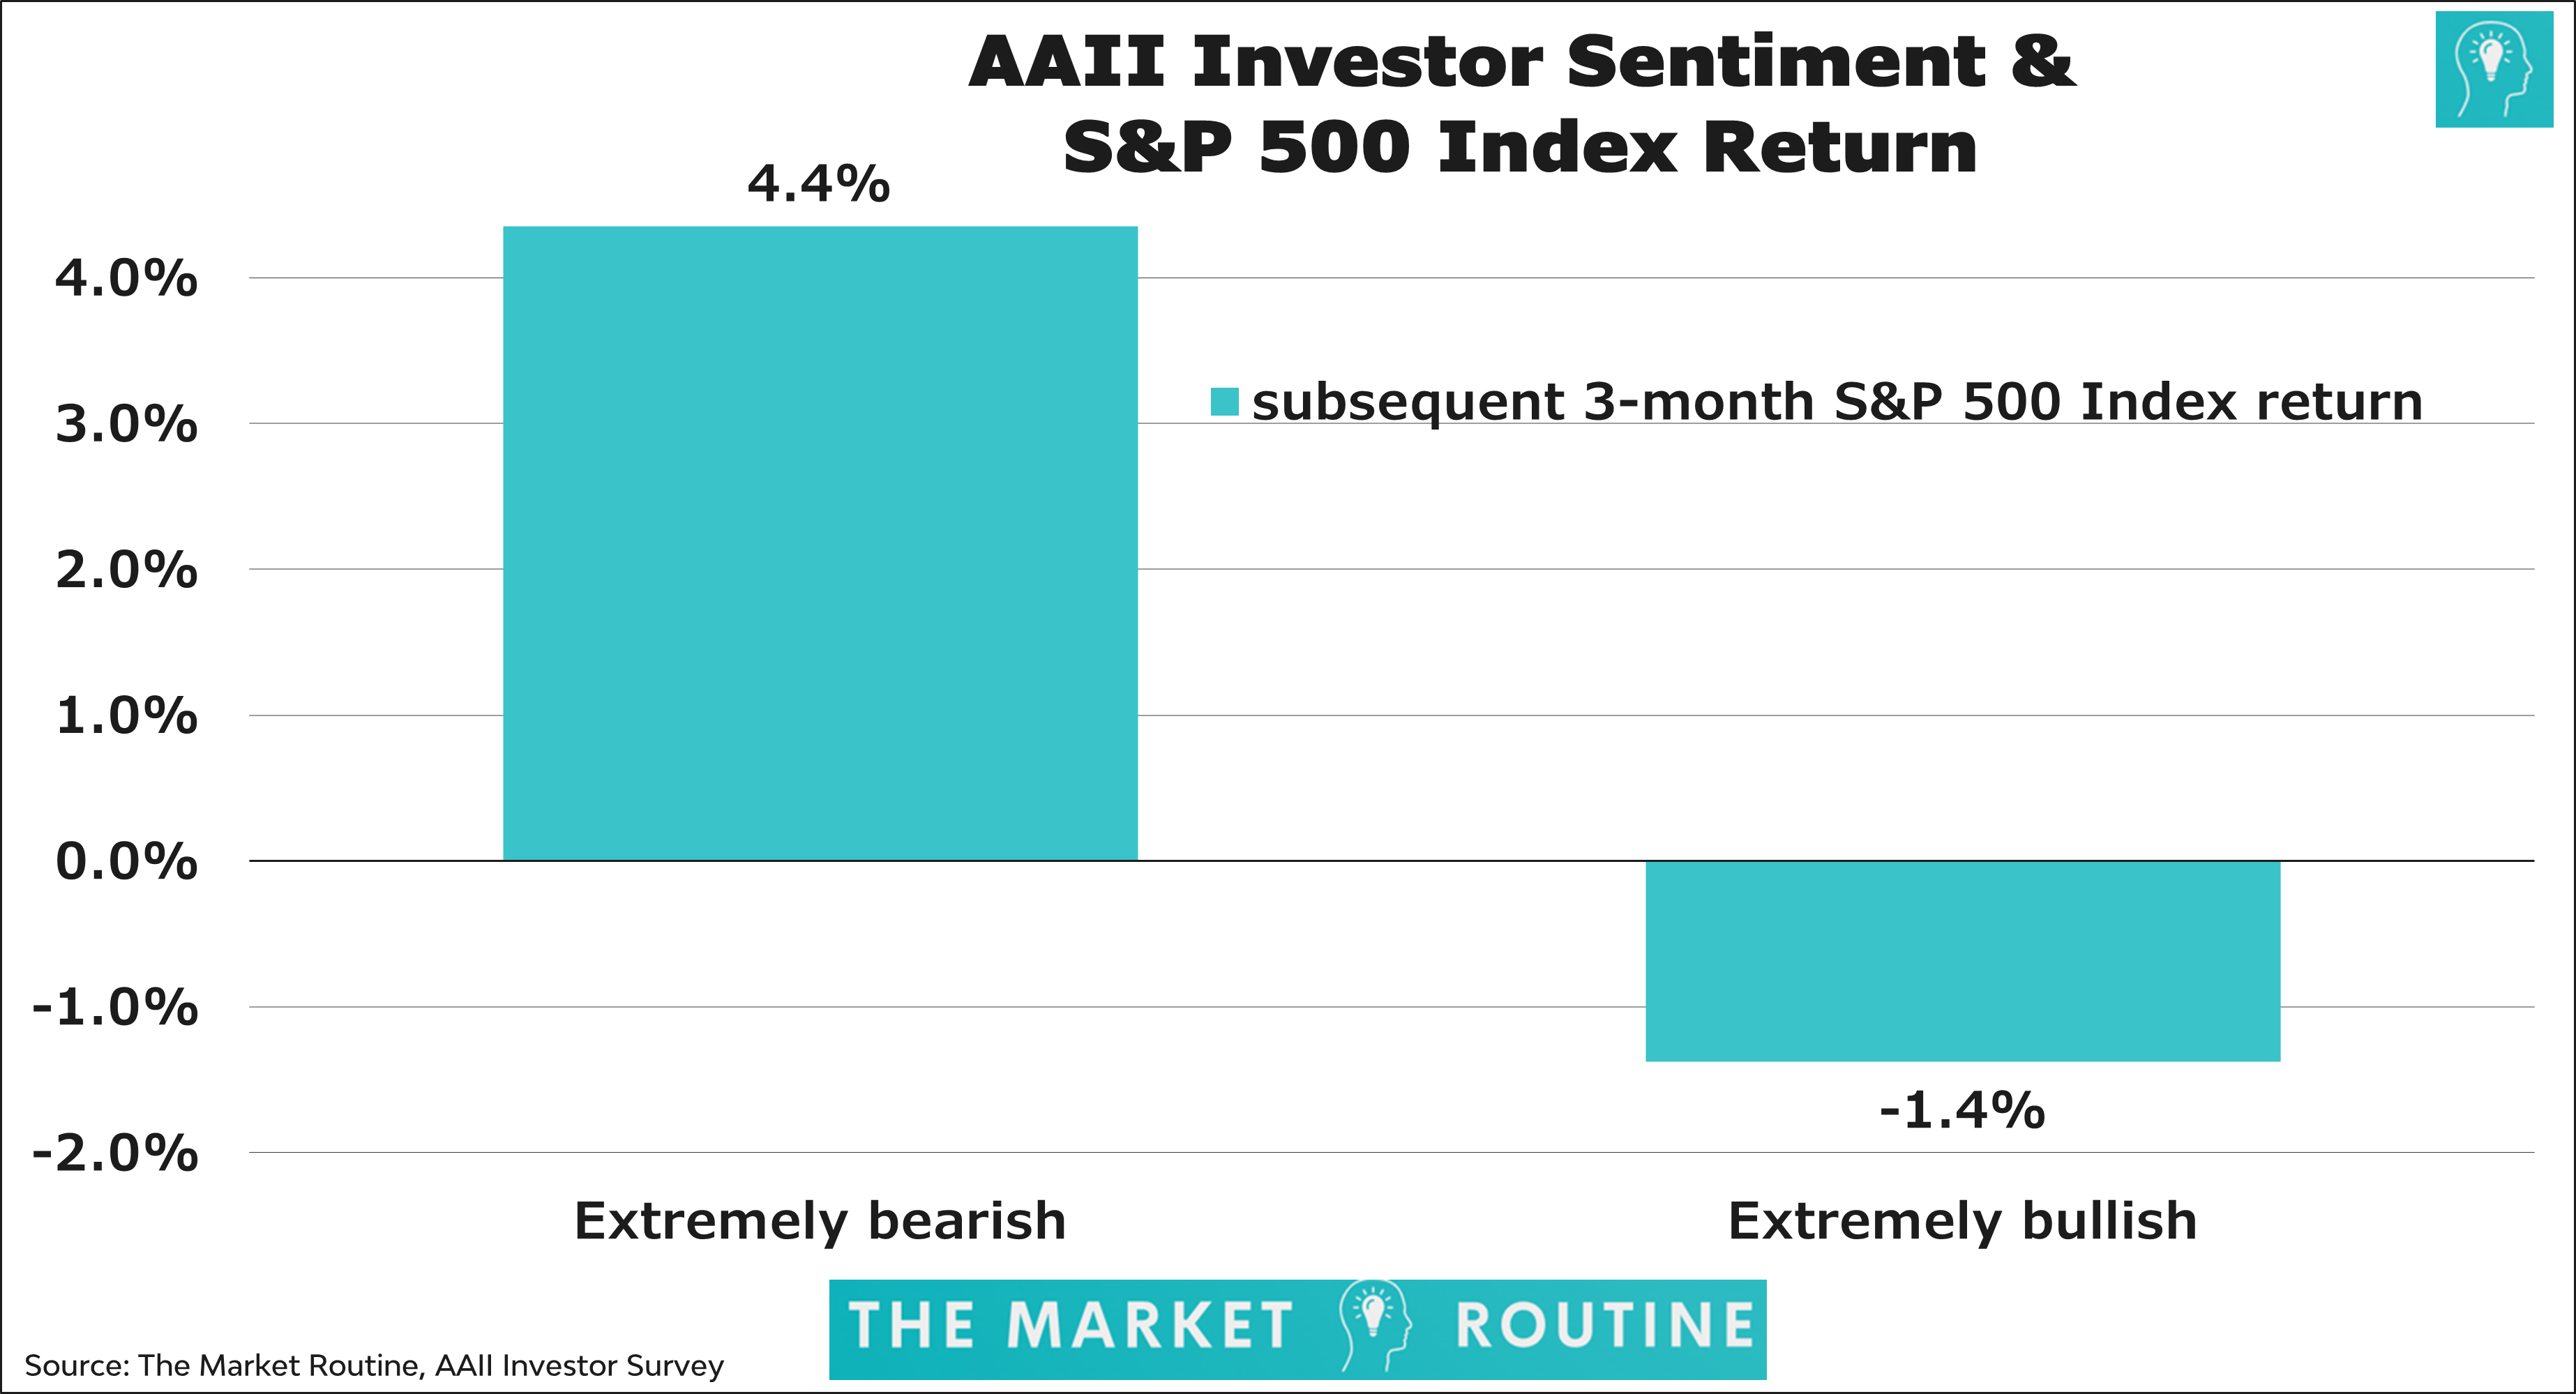
The conclusion that very bullish retail investors are bearish for stocks is often applied, but I rarely see the quantitative substantiation behind this assumption. Here you have it.
Active Money Manager Exposure
The NAAIM Exposure Index is calculated as the average exposure to US Equity markets of active money managers who are members of the National Association of Active Investment Managers, NAAIM.
'NAAIM member firms who are active money managers are asked each week to provide a number which represents their overall equity exposure at the market close on a specific day of the week, currently Wednesdays.' The following range of responses are applicable:
200% Leveraged Short
100% Fully Short
0% (100% Cash or Hedged to Market Neutral)
100% Fully Invested
200% Leveraged Long
Like the AAII Investor Survey, the NAAIM survey is also conducted weekly, making the comparison more relevant. Note that active fund managers can include 'leverage' in their exposure numbers. If they are extremely positive, their exposure can go up to 200% long.
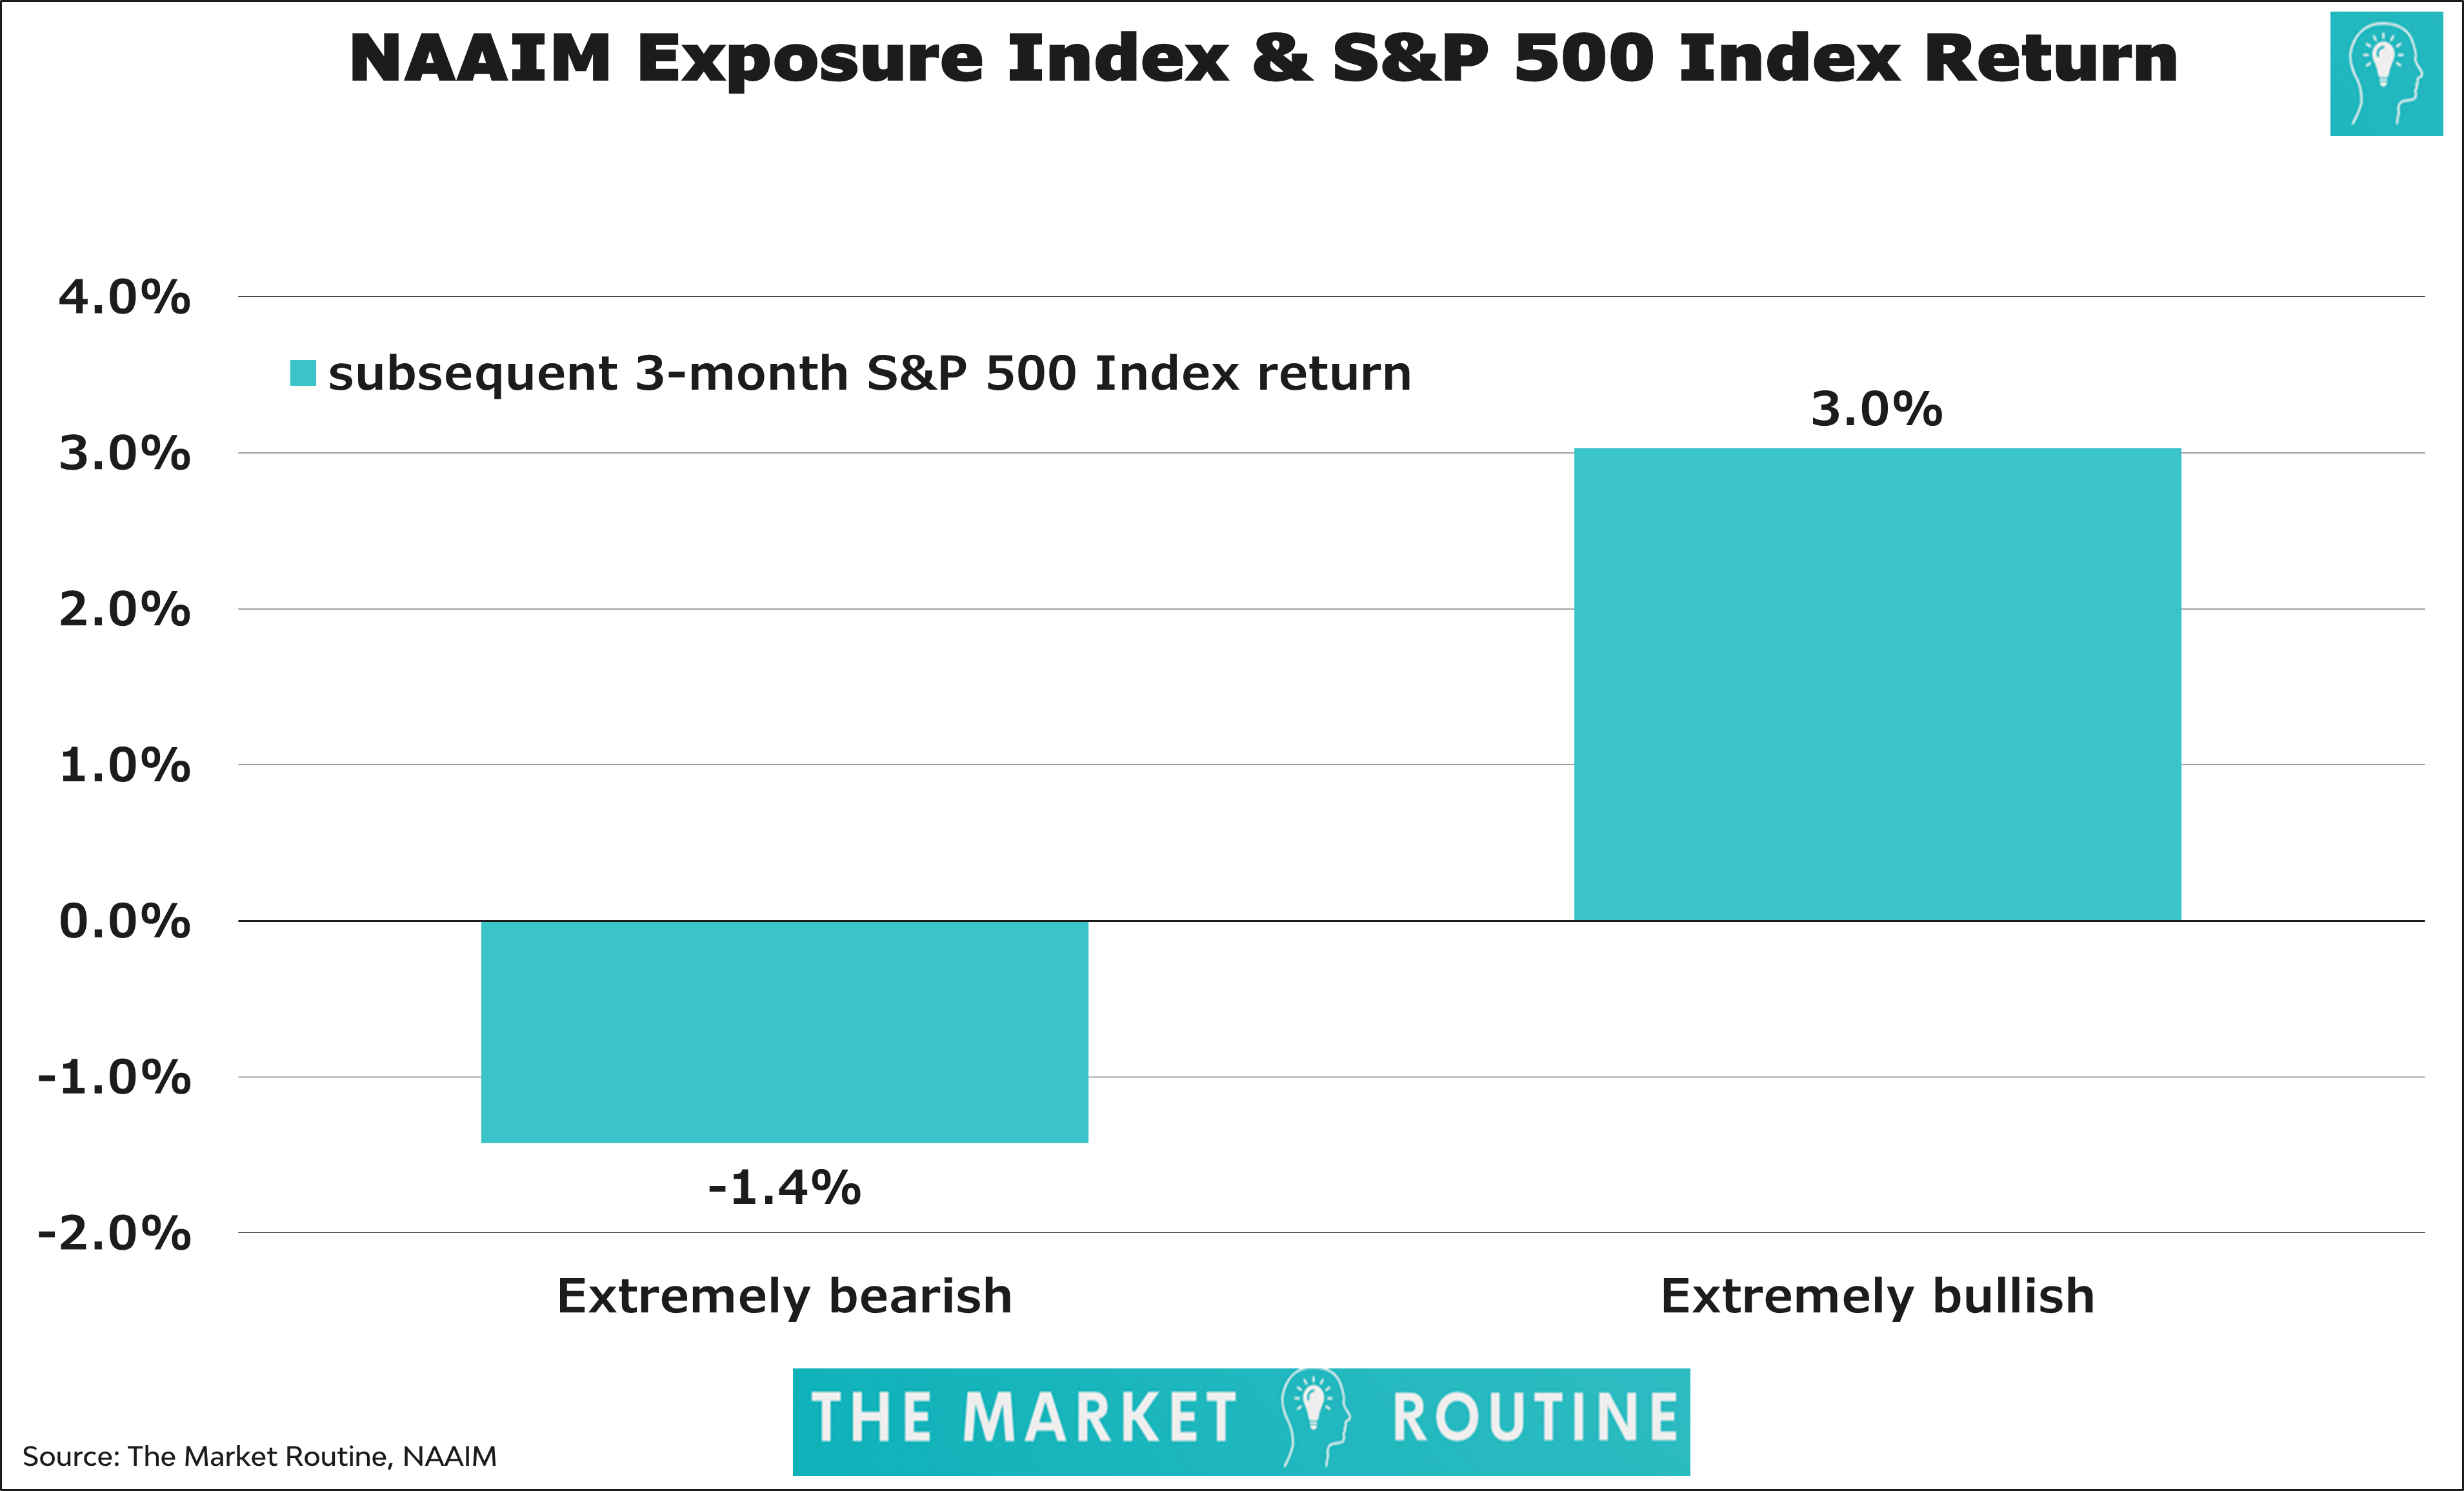
In the last survey, the NAAIM Exposure Index stood at 99.05. Based on the historical distribution of outcomes, this exposure number is also extreme. However, the NAAIM Exposure Index is NOT a contrarian indicator. Quite the opposite. When American active money managers increase their exposure to US stocks to extreme levels, the S&P 500 Index realized an average 3-month future return of 3.0%. Hence, the return is better than the average return of almost 2% measured over all three-month periods.
Contradiction
We are currently seeing extremely positive US retail investors and active money managers. And based on an analysis of the future 3-month returns, they provide a completely different picture. Based on the AAII Investor Survey, you should now be reducing your allocation to stocks, while the NAAIM Exposure Index suggests a larger weight of stocks in your portfolio.
But the contradictions do not end here. The latest Bank of America Global Fund Manager Survey shows that global fund managers are heavily underweight stocks. This survey reflects the positioning of yet another segment of investors, which may result in different outcomes. Moreover, fund managers outside the US could explain most of the bearishness and not so much US managers. Still, the discrepancy with the NAAIM Exposure Index is noteworthy.
Conclusion
I've had my doubts about the cautious positioning of global fund managers. For instance, the Artificial Intelligence boom largely explains the extreme short position in S&P 500 Index futures seen for most of this year. To realize the extraordinary returns on Big Tech stocks, institutional investors have bought tech stocks while selling S&P 500 Index futures to maintain overall equity market exposure.
In addition, the AAII Investor Survey represents the stronger variable of the two. The significance of the returns shown above is higher for the AAII Investor Survey. Nevertheless, it remains striking that both surveys give a contradictory signal. Do you follow the 'dumb' retail money or the 'smart' fund investor money? I lean towards the former.
Sources:
AAII Investor Sentiment Survey data: https://www.aaii.com/sentimentsurvey
NAAIM Exposure Index data: https://www.naaim.org/programs/naaim-exposure-index/