

How to Build your own Recession indicator
The investment case for Corporate Bonds

The Market Routine aims to increase your knowledge of financial markets and generate investment ideas. In this article, I will demonstrate how to construct a recession indicator using publicly available data and how to use it to determine the relative attractiveness of Corporate Bonds and High Yield Bonds.
Use market data to derive implied recession odds
Generally, determining the likelihood of a recession can be achieved through two approaches. First, by examining macroeconomic indicators, such as the ISM Manufacturing Index, housing market statistics, payroll numbers, and consumer confidence. And second, by analyzing market data, such as commodity prices, yields, and spreads.
Despite the inherent imperfections of macroeconomic indicators, they often receive a disproportionate amount of attention. Instead, market data like spreads on corporate bonds make useful recession indicators too.
To assess the odds of a recession, I prefer a combination of both macro and market indicators, which together make up my Recession Scoreboard.
The Fred Database
When conducting market research, you will have come across the FRED database at https://fred.stlouisfed.org/, the economic database for the St. Louis Federal Reserve. The database contains an impressive collection of 819,000 US and international time series from 110 sources, offering a wealth of data to explore.

The database holds several time series on corporate bonds. Among them are the ICE Bank of America US Corporate and High Yield Index Option-Adjusted Spreads. These spreads represent the additional yield investors require on top of US Treasuries with the same maturity, compensating for perceived default risk. Obviously, High Yield Bonds offer higher spreads than Corporate Bonds due to the higher default risk of companies with lower creditworthiness.

While many investors use these charts to quickly gauge current spreads in relation to history, they can be transformed into a valuable multi-asset valuation tool that can be integrated into investment frameworks with ease.
Deriving implied recession odds
When it comes to recessions, not all are equal, but similar patterns tend to occur. One of these patterns is spread widening. By analyzing the extent to which spreads widen during expansions and in the run-up to and during recessions, it becomes straightforward to derive the implied recession odds that corporate bonds are pricing.
Let's focus on US high yield bonds first. During US recessions identified by the National Bureau of Economic Research (NBER), the average high yield spread is 10.37 percentage points or 1037 basis points. The average high yield spread during expansions is 4.87 percentage points or 487 basis points. The implied recession odds are then calculated using the following equation:
(Current spread minus average spread during expansions) /
(average spread during recessions minus average spread during expansions)
For instance, if the current high yield spread is 600 basis points, the implied recession odds would be:
(600-487)/(1037-487) = 21%
The same principle applies to corporate bonds. The average spread during recessions is 319 basis points, while it is 134 basis points during non-recessions. By applying the above formula to the current spread of corporate bonds, we can determine the corporate bond-related implied recession odds.
Asset Allocation decisions
Obviously, no indicator is perfect, and it's often tempting to put the label of 'this time is different' on current market conditions. However, using implied recession odds derived from asset pricing can provide valuable information on investors' expectations for future GDP growth.
Moreover, implied recession odds offer another compelling aspect; asset allocation views. By comparing the implied recession odds of different asset classes – I do this for Equities, Treasuries, Commodities, and Corporate and High Yield Bonds – it's possible to make asset allocation decisions. For instance, when my Macro models suggest high recession odds, but corporate bonds show little risk of recession compared to other asset classes, shorting or selling corporate bonds may provide the best opportunity to reflect a recessionary outlook.
The data to build this little asset allocation and recession tool is freely available on the FRED database.
What about the current risks of a recession?
Something interesting in going on in high yield and corporate bonds.

As of the last close, the high yield spread is 399 basis points, and that of corporate bonds is 123 basis points. This means that the spreads of both asset classes are below their average level during expansions, implying a 'negative' probability of a US recession. Since, this is not possible, the implied recessions odds of these two asset classes are zero.

This contrasts sharply with some macroeconomic recession indicators, such as the ISM Manufacturing Index, which has dropped to 47.4 and looks set to drop further in the coming months.
To make things even more interesting, the latest Bank of America Global Fund Manager Survey reveals that long Corporate Bonds are now second on the list of most-crowded trades. Everyone wants corporate bonds!

Despite this optimism, the risk-reward trade-off for corporate and high yield bonds may not be that great.
First, based on the indicators in my Recession Scoreboard, the odds of a recession remain high, even though they have come down in recent weeks.
Second, with inflation being stubbornly high and central banks continuing to adopt hawkish rhetoric, the case for duration has weakened significantly. The chart below shows US Treasury yields have risen across the curve.

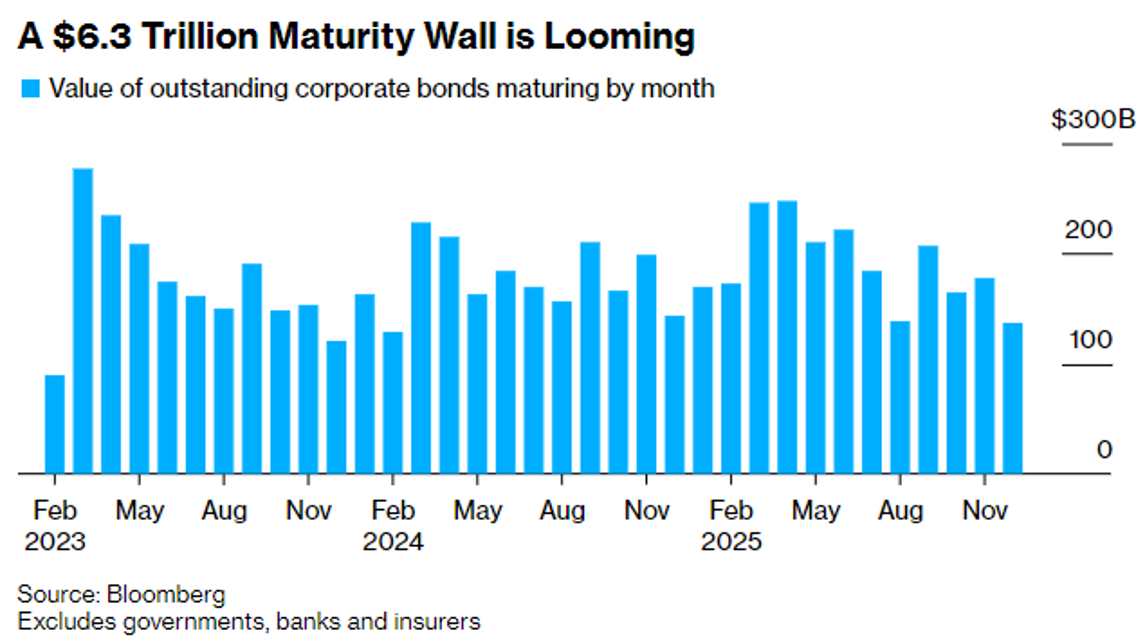
Third, a USD 6.3 trillion maturity wall is waiting, and refinancing will be at much higher yields.
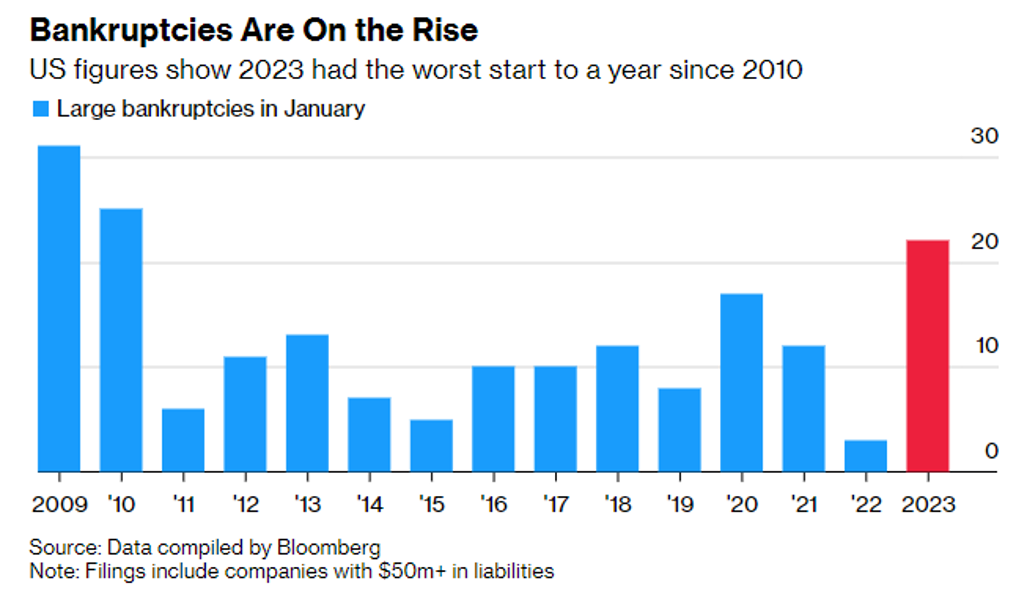
Fourth, defaults are already rising, albeit from a low level. This hits high yield bonds harder because companies with low creditworthiness will do most of the defaulting. But contagion risks between high yield and corporate bonds are common.

Fifth, the end of There Is No Alternative (TINA) is also an issue for corporate bonds. Roughly one-third of the corporate bonds in the USD Investment Grade iBoxx index had a yield below the 3-month US Treasury Bill, meaning that investors get more risk and less yield.


So why are corporate bond spreads so tight? I think there are two main reasons. The first is that the percentage of long-term financing of corporate debt has risen significantly since the Great Financial Crisis. This means it takes (much) longer for higher interest rates to work through the corporate bond universe.
The second is that markets have tightly embraced the 'immaculate disinflation + soft landing' narrative. But both elements of this narrative are shaky at best. Underlying inflation data reveal risks remain elevated. And after better-than-expected retail sales spending and a massive jobs number – both of which cannot be downplayed entirely due to seasonal adjustments – there is hardly any landing. And this forces the Federal Reserve to continue hiking, increasing the odds of a recession with every hike. Corporate Bonds, and High Yield bonds in particular, don't look that attractive to me, mainly because they price ZERO chance of a recession.