
Inflation X Powell: two steps forward, one step back!
Inflation X Powell: two steps forward, one step back!
Sticky prices fell for the first time in over four year, but markets want liquidity now!

Wednesday, June 12, will likely turn out to be the most crucial day of recent and upcoming weeks. It was only the thirteenth time since 2008 that the U.S. inflation report and the Federal Reserve FOMC meeting coincided on the same day. Two pivotal events, with very different outcomes and market implications.
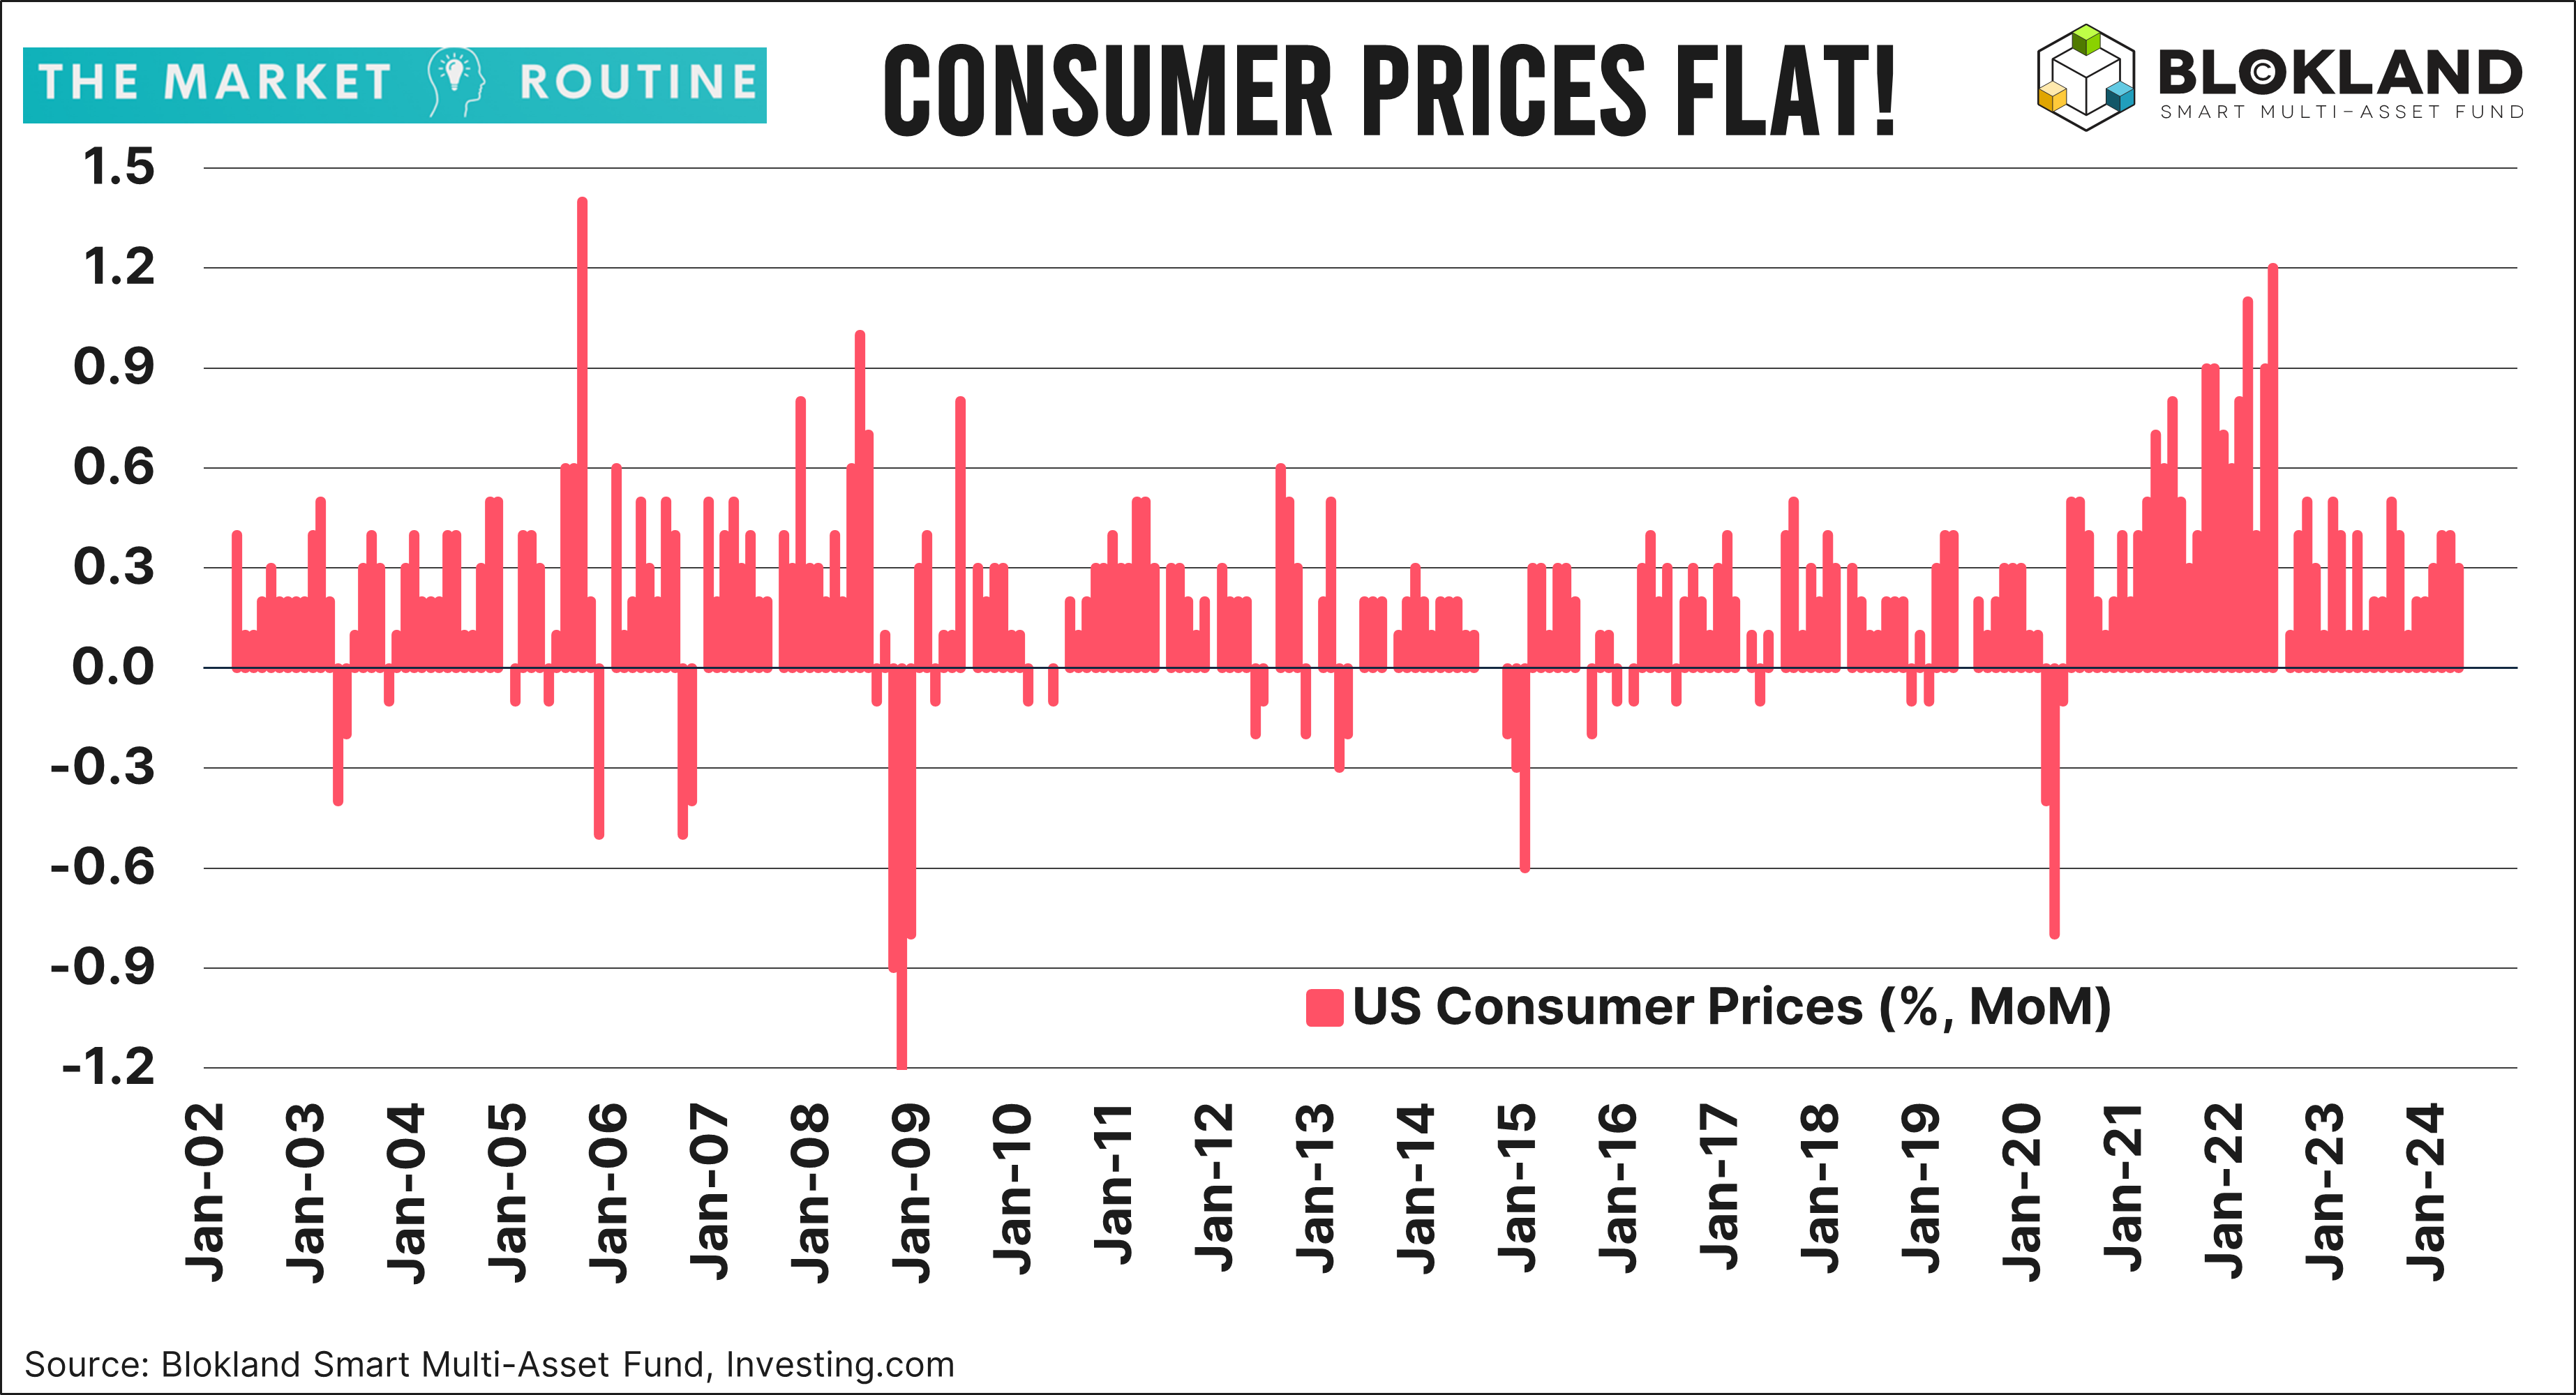
Event 1: Prices Unchanged
In May, consumer prices did not increase. This was the first occurrence since July 2022, almost two years ago. In many ways, this was good news. First, it was lower than expected, and expectations, or rather, deviations from expectations, are what drive prices and rates. Second, it represents very welcome news for consumers after a cumulative price increase of a whopping 23%(!) over the past four years.
The Core
Furthermore, various measures of core inflation significantly decreased. The chart below shows three key examples:
The 'original' core index (3-month annualized down to 3.3% from 4.1%)
The Core Services ex Shelter CPI (3-month annualized down to 4.2% from 6.3%)
The Atlanta Core Sticky CPI (3-month annualized down to 2.8% from 4.2%)
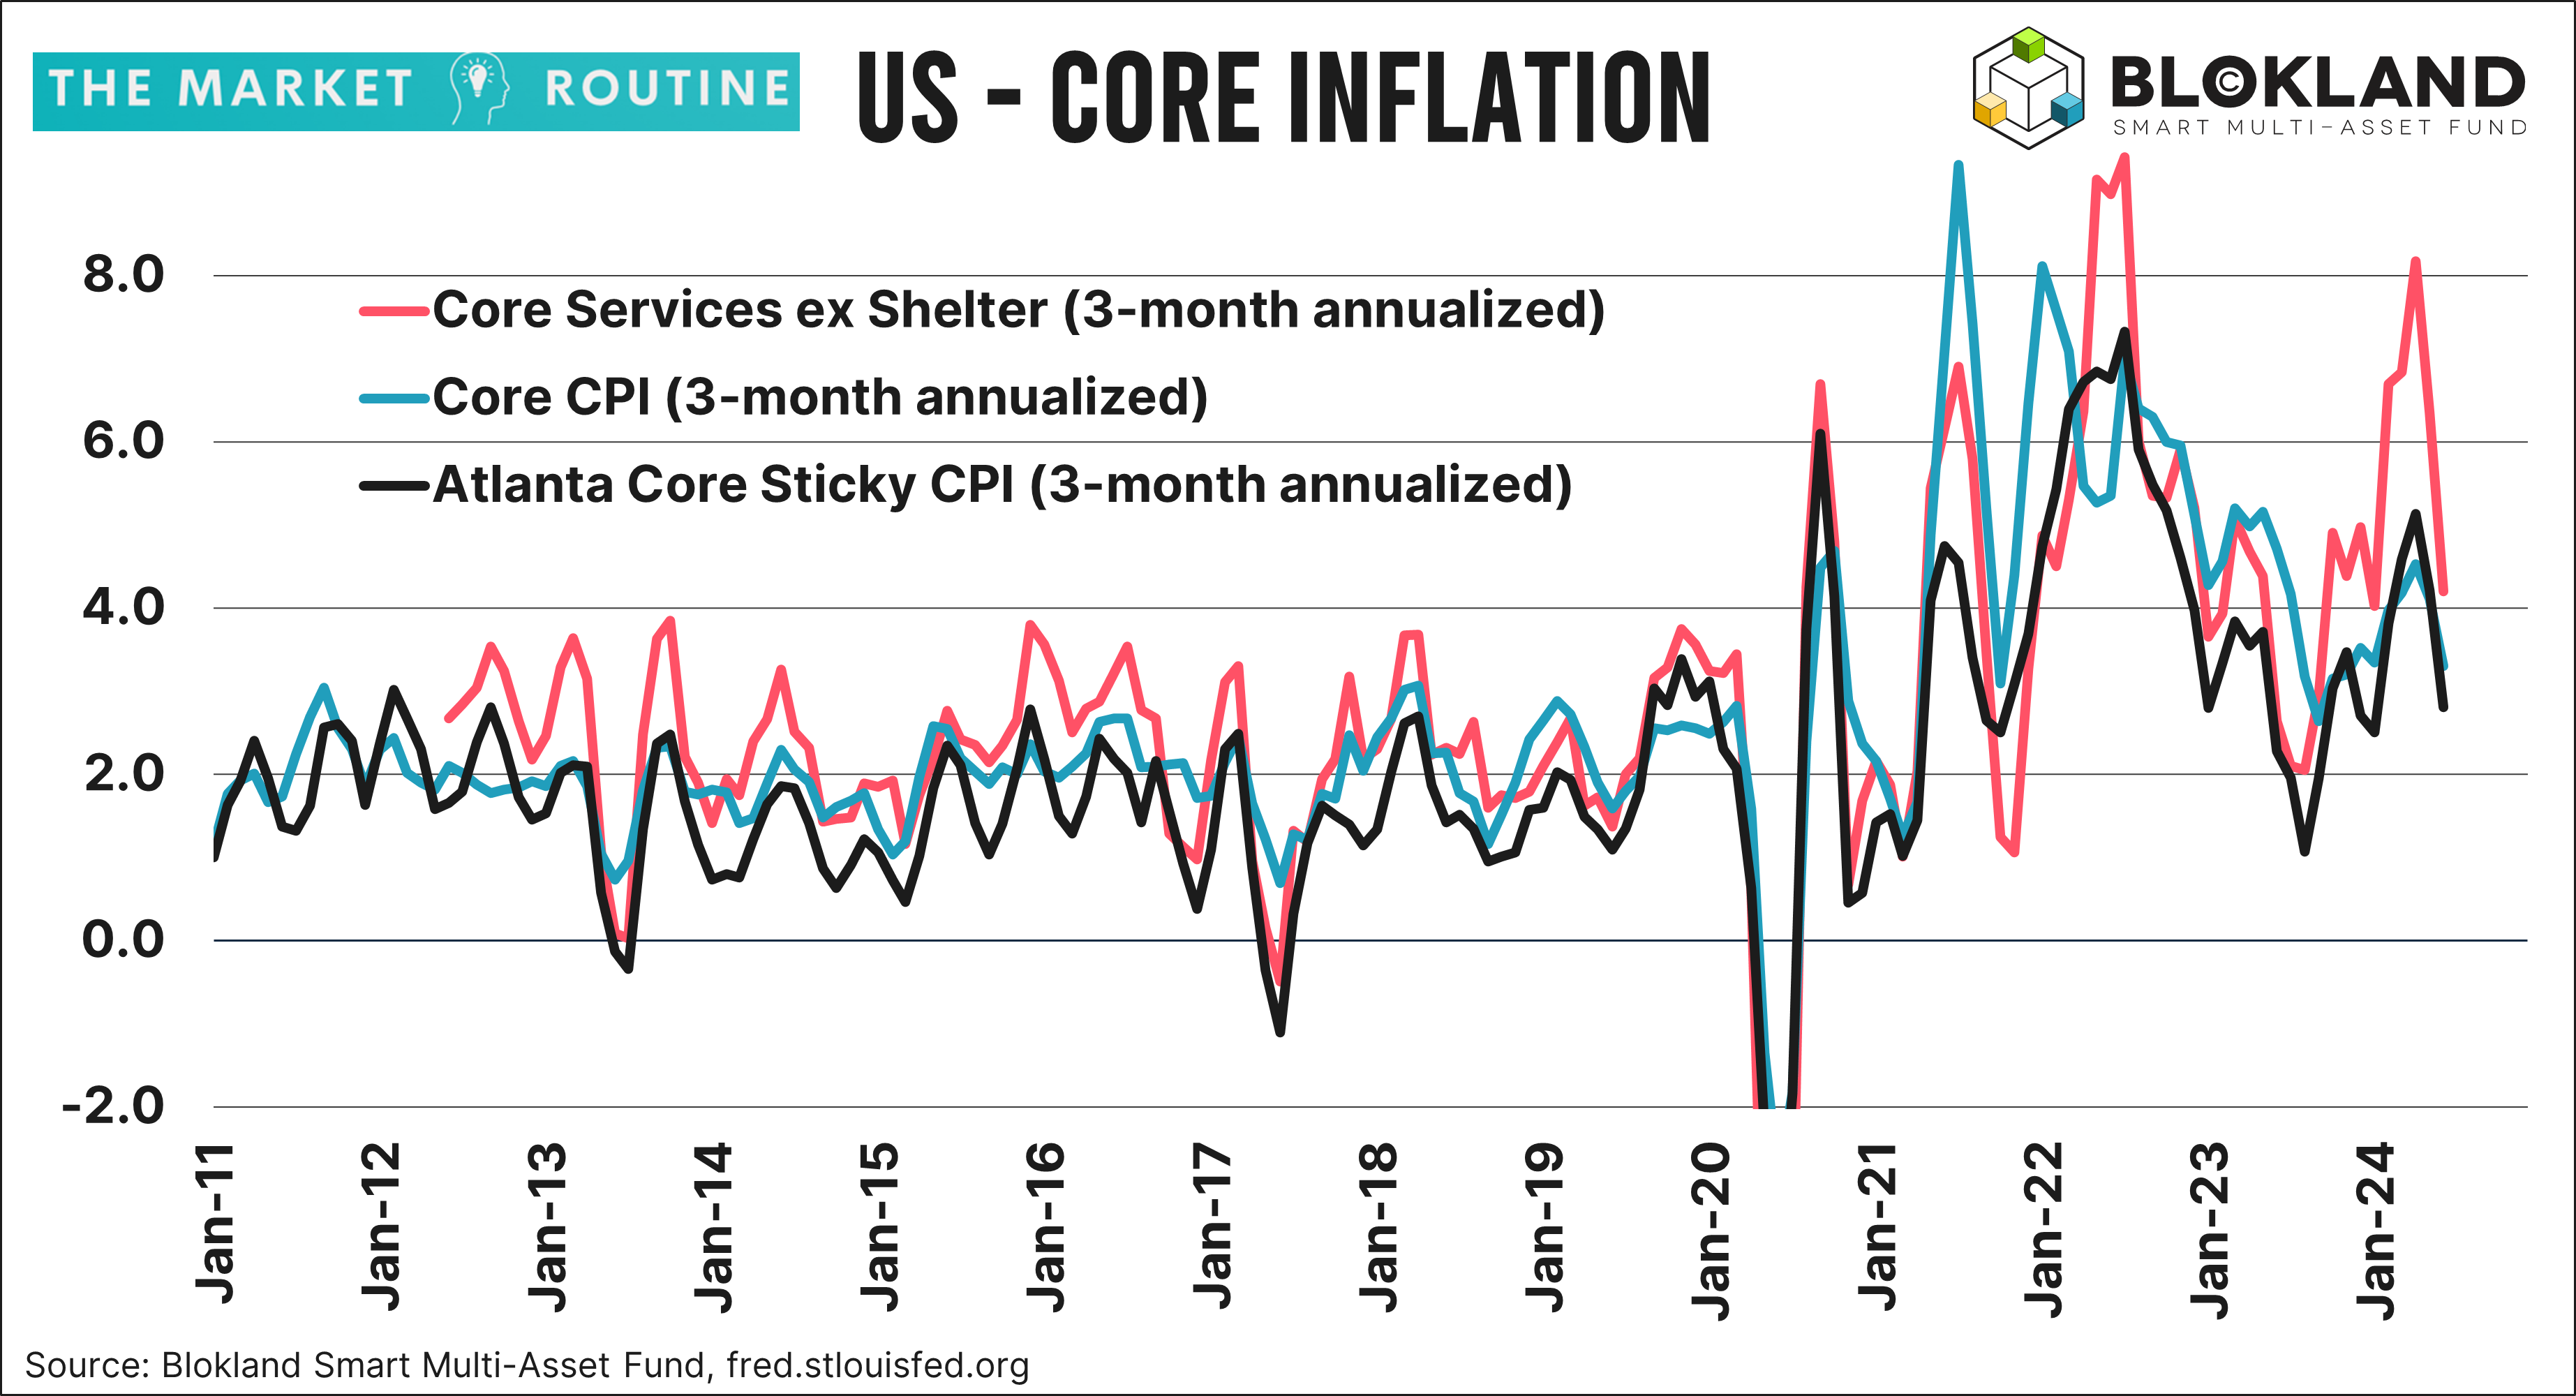
It should be clear that these values are still significantly away from the Federal Reserve's inflation target. However, the mini-inflation scare between February and April has been largely erased.
The following chart is probably one you are unlikely to witness often. The Atlanta Core Sticky Price Index, which tracks the development of prices for goods and services that typically change slowly, declined in May. In other words, these sticky prices went down. We must go back to January 2021 to find the last time this happened!
In conclusion, given the extreme sensitivity of financial markets to inflation, it is understandable that nearly all markets spiked. Especially if you embrace, as I do, that the Federal Reserve and other central banks are willing to lower interest rates well before the inflation target is reached.
Not Giving You Anything
My impression from the Powell press conference following the FOMC decision to keep interest rates unchanged is that he did not want to give the markets anything to rally on this time and to focus entirely on being data-dependent.
And that's entirely understandable. The CPI reports for the early months of the year were outright ugly. And it makes sense, with the inflation peak of 2022 still fresh in memory, that central banks would want to sound cautious. After all, you don't earn back credibility overnight.
It also makes sense that stocks, gold, and Bitcoin had to give up some of their gains after the FOMC and struggle a bit again today. To me, the clearest chart causing market jitters is the Fed' Dot Plot.'
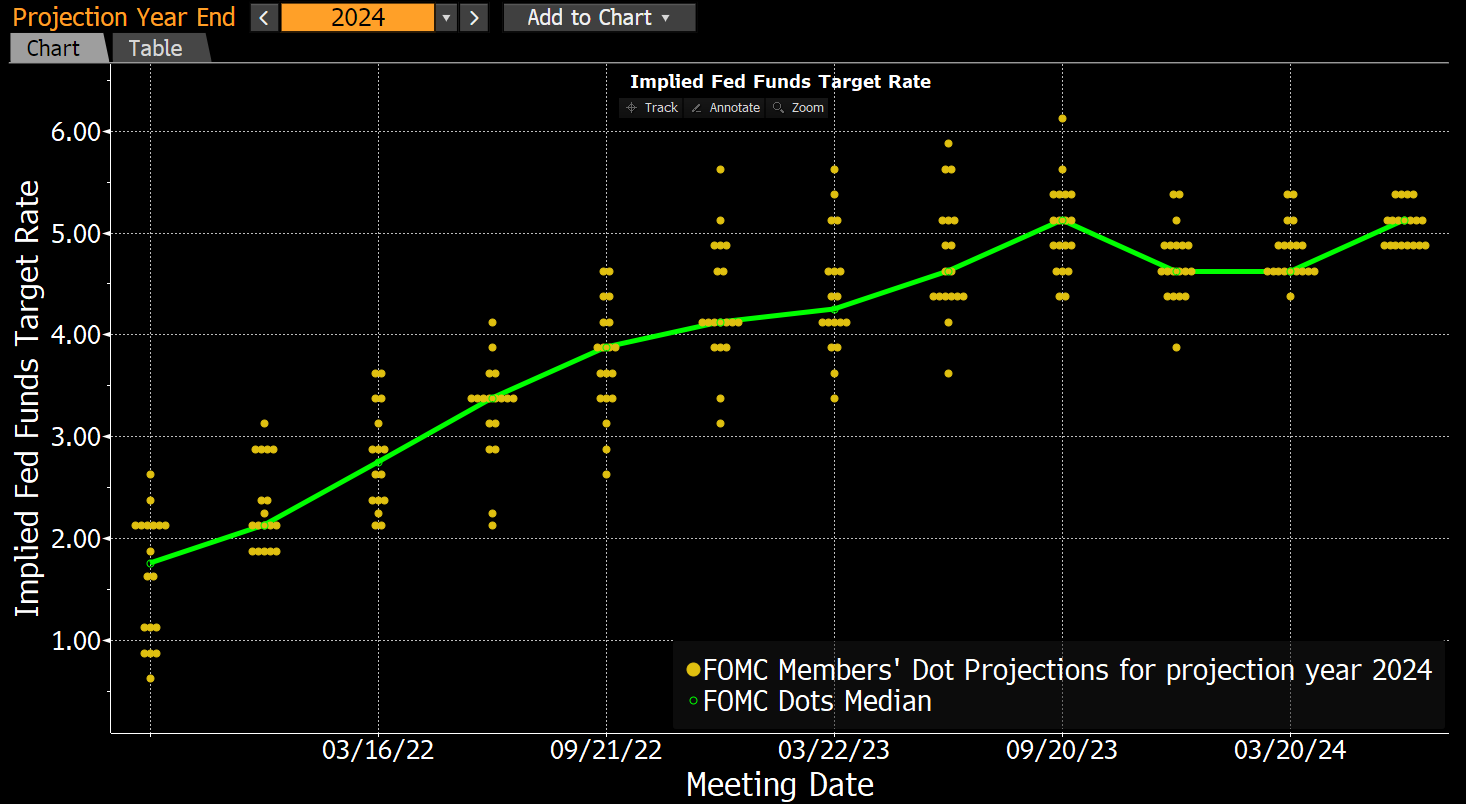
Above is the development of the 'median' dot, i.e., the interest rate expected by the FOMC member right in the middle of the ranking of all the dots for 2024. The most recent median dot equals 5.125%, the highest we have seen this cycle. The Fed is now pricing in just one rate cut, although you can read from the chart that quite a few FOMC members expect two cuts.
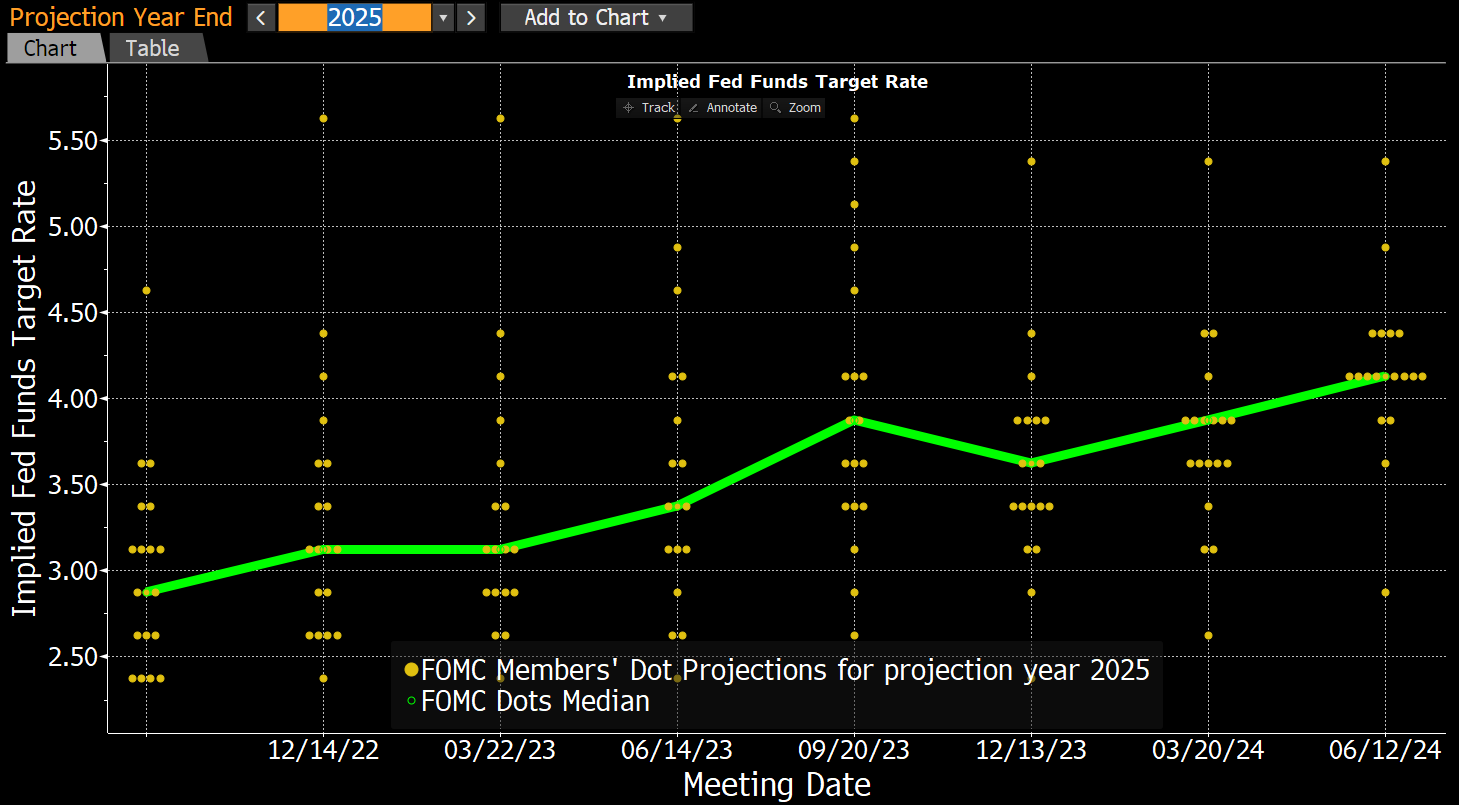
The Dot Plot for 2025 continues to grind higher!
What Powell wants
However, I still expect the Fed to cut the rate by at least three-quarters of a percentage point. During the press conference, Powell made abundantly clear that the Fed finds the current interest rate level quite restrictive. However, the other side of the mandate, maximum employment, has not yet enabled the FOMC to lower rates. In Powell's words, whether the interest rate level is restrictive enough remains to be seen.
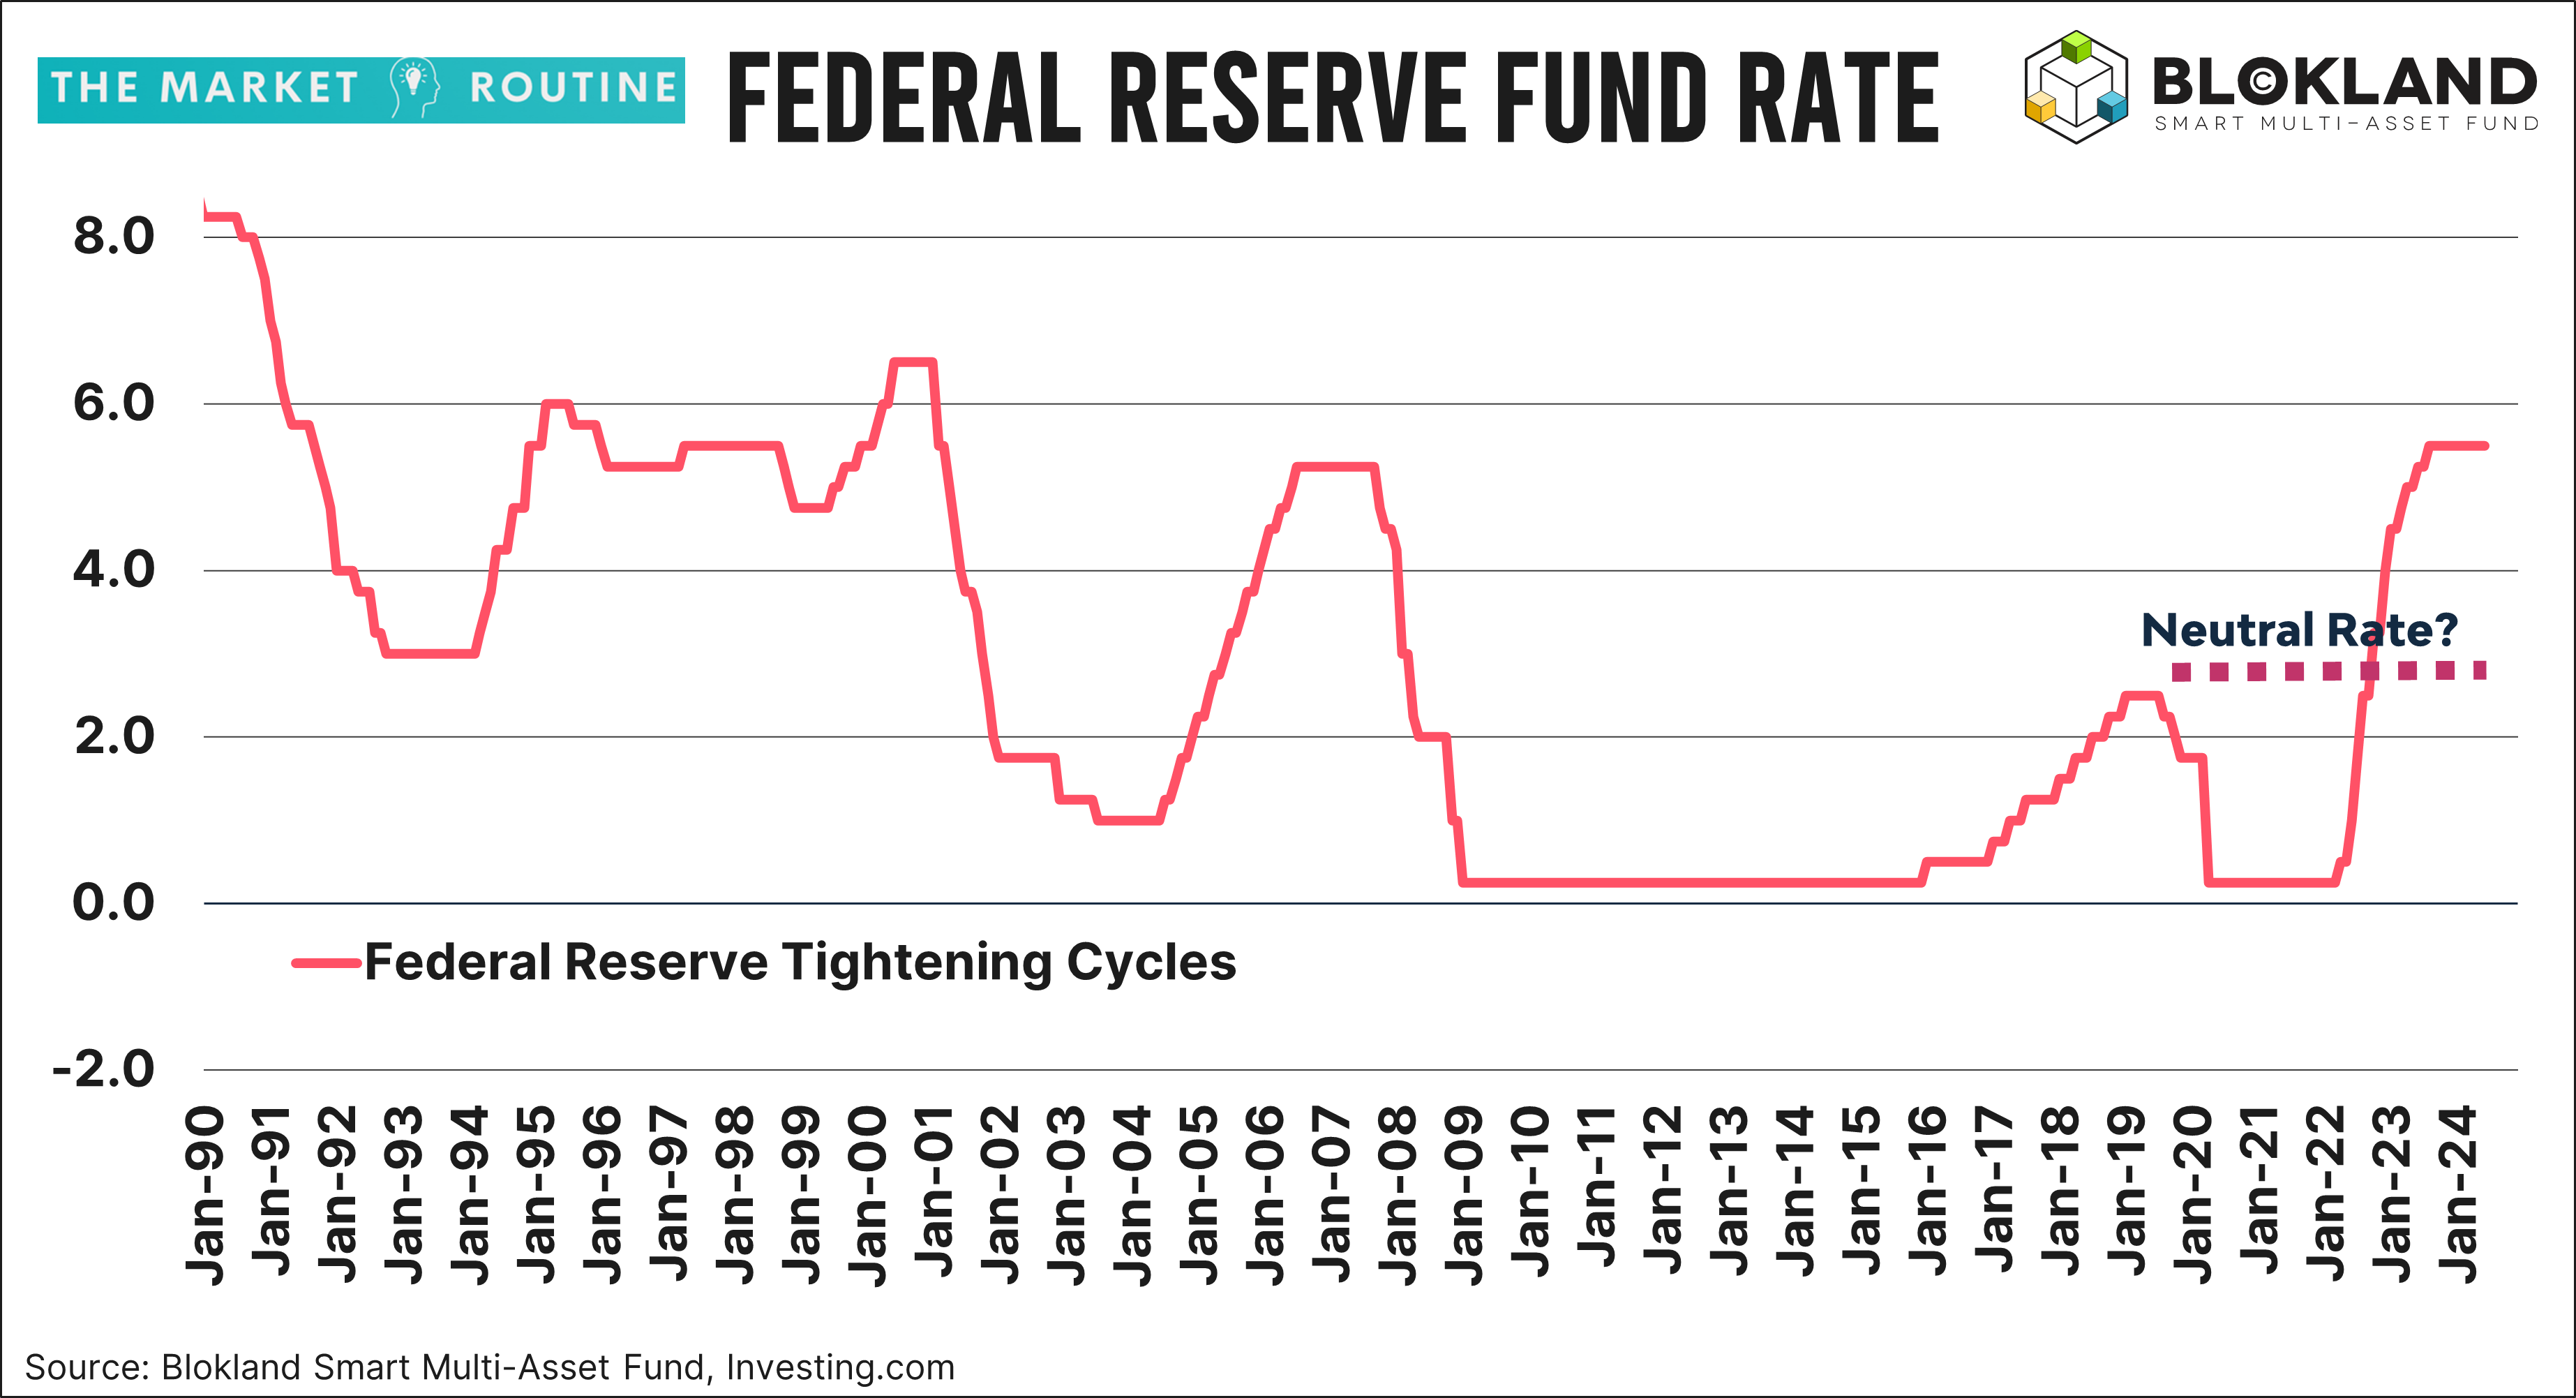
Below are two charts underpinning the Fed's restrictiveness. The first shows the Fed Target Rate (5.50% upper bound) relative to what is supposed to be the current neutral rate, meaning the level at which economic growth is at a pace that will result in the 2% inflation target. This rate is currently extimated to be 2.5%, which I think is elevated given the downward trend in potential economic growth and the debt sensitivity of the U.S. economy. Even if the Fed cuts rates by six quarters, we are still one and a half percentage points above that assumed neutral rate.
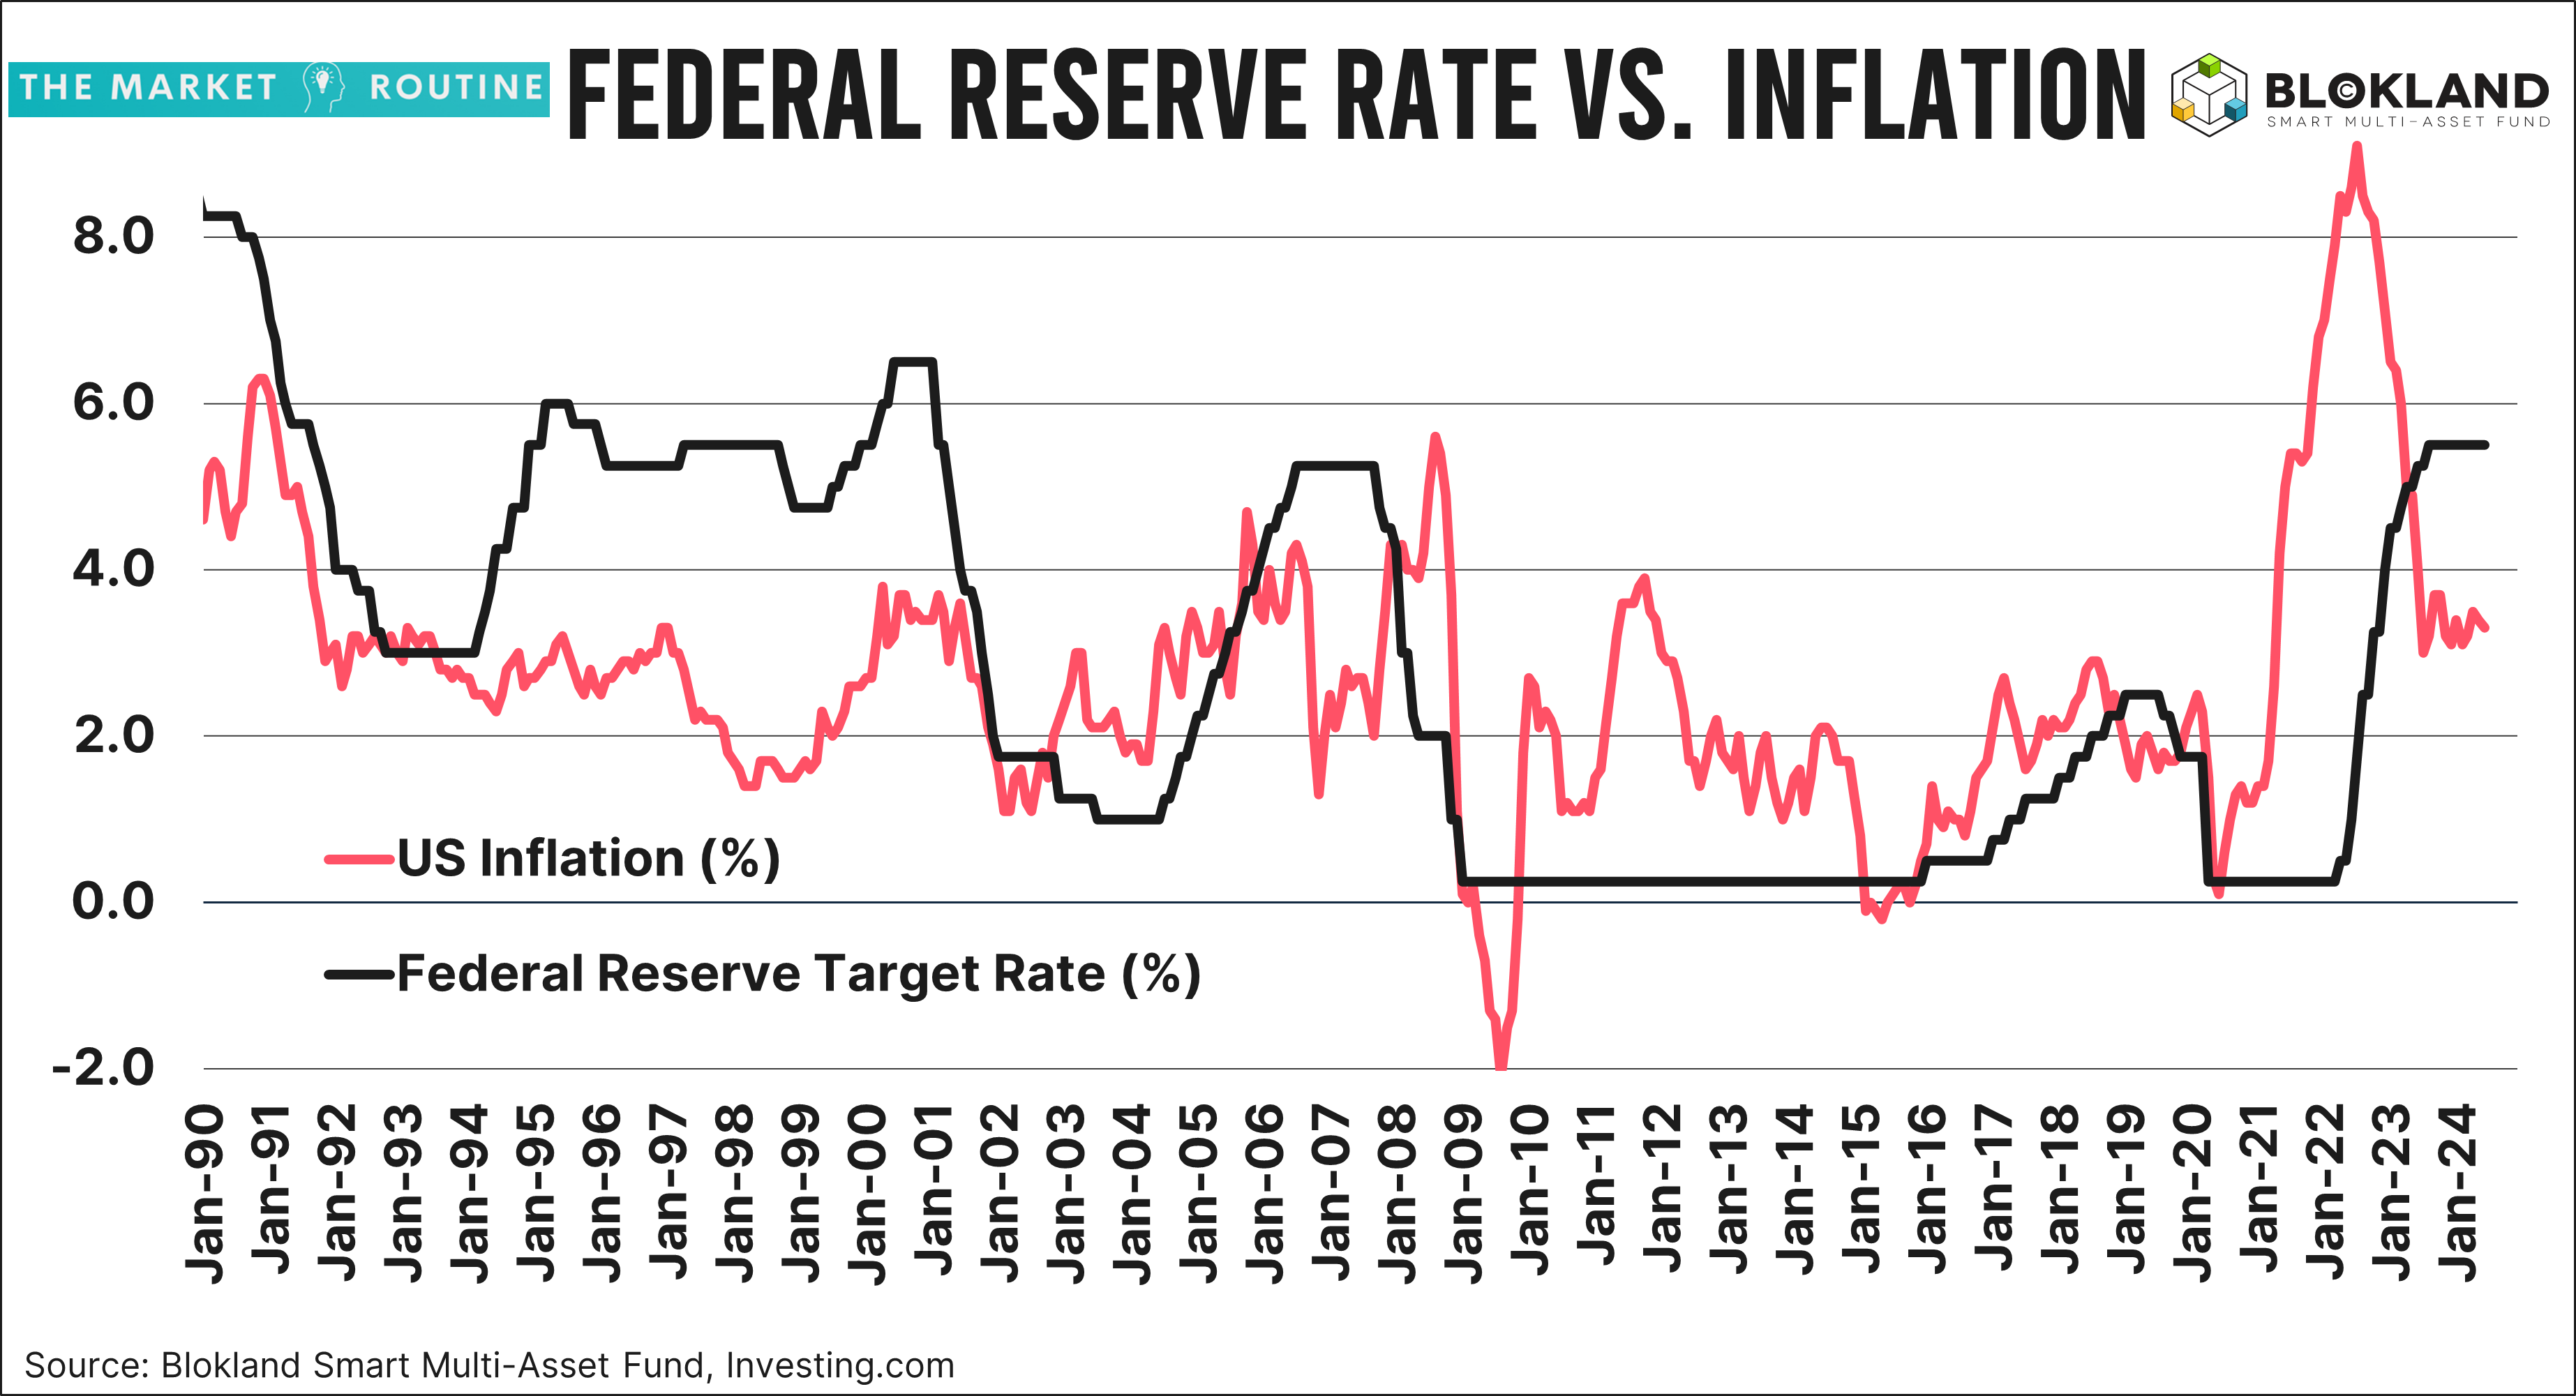
The second chart compares the Fed rate with headline inflation. The difference between the two is currently 2.3% (again based on the upper bound), almost five times more than the average gap from 1990 to 2020.
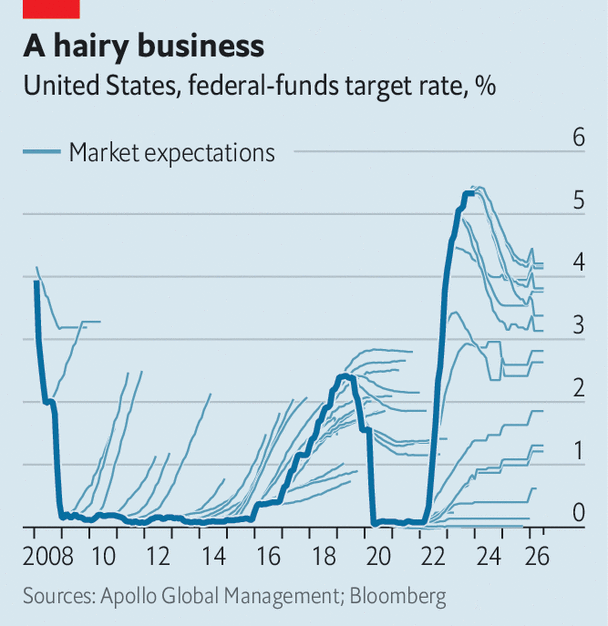
Even without taking into account the 'implicit' objective of debt sustainability, which, in my view, is abundantly clear —you only need one look at the Fed balance sheet—the Fed needs little incentive to lower rates. Even a modest weakening of the labor market, which should now become evident based on the historical pattern between rates and unemployment, will be a reason to further open the door to rate cuts. What the current Dot Plot tells us should be taken lightly. Both the Fed and the markets have a poor reputation when predicting the Target Rate.