


Taking the Bitcoin Halvings out of Isolation
Why Spot Bitcoin ETFs can be the catalyst to new all-time highs

Before I delve into the three previous Bitcoin halvings, let me clarify one thing immediately. Drawing strong conclusions from a sample of three is far from obvious. While some interesting similarities can be observed, statistical significance will be shallow.
The second point I’d like to make – and what, in my opinion, makes an analysis of the previous halvings worthwhile – is that the three earlier halvings did not occur in isolation. Nevertheless, I see very few – in fact, none at all – analyses attempting to put things into perspective. I will do so and reveal how the approval of US spot Bitcoin ETFs may become the catalyst of this halving cycle.
Three halvings in one chart
The chart below shows the price development of Bitcoin (USD) 365 days before and 365 days after the previous halving dates. Due to the extreme returns around and especially after the 2012 halving, this occasion is displayed on the right axis.
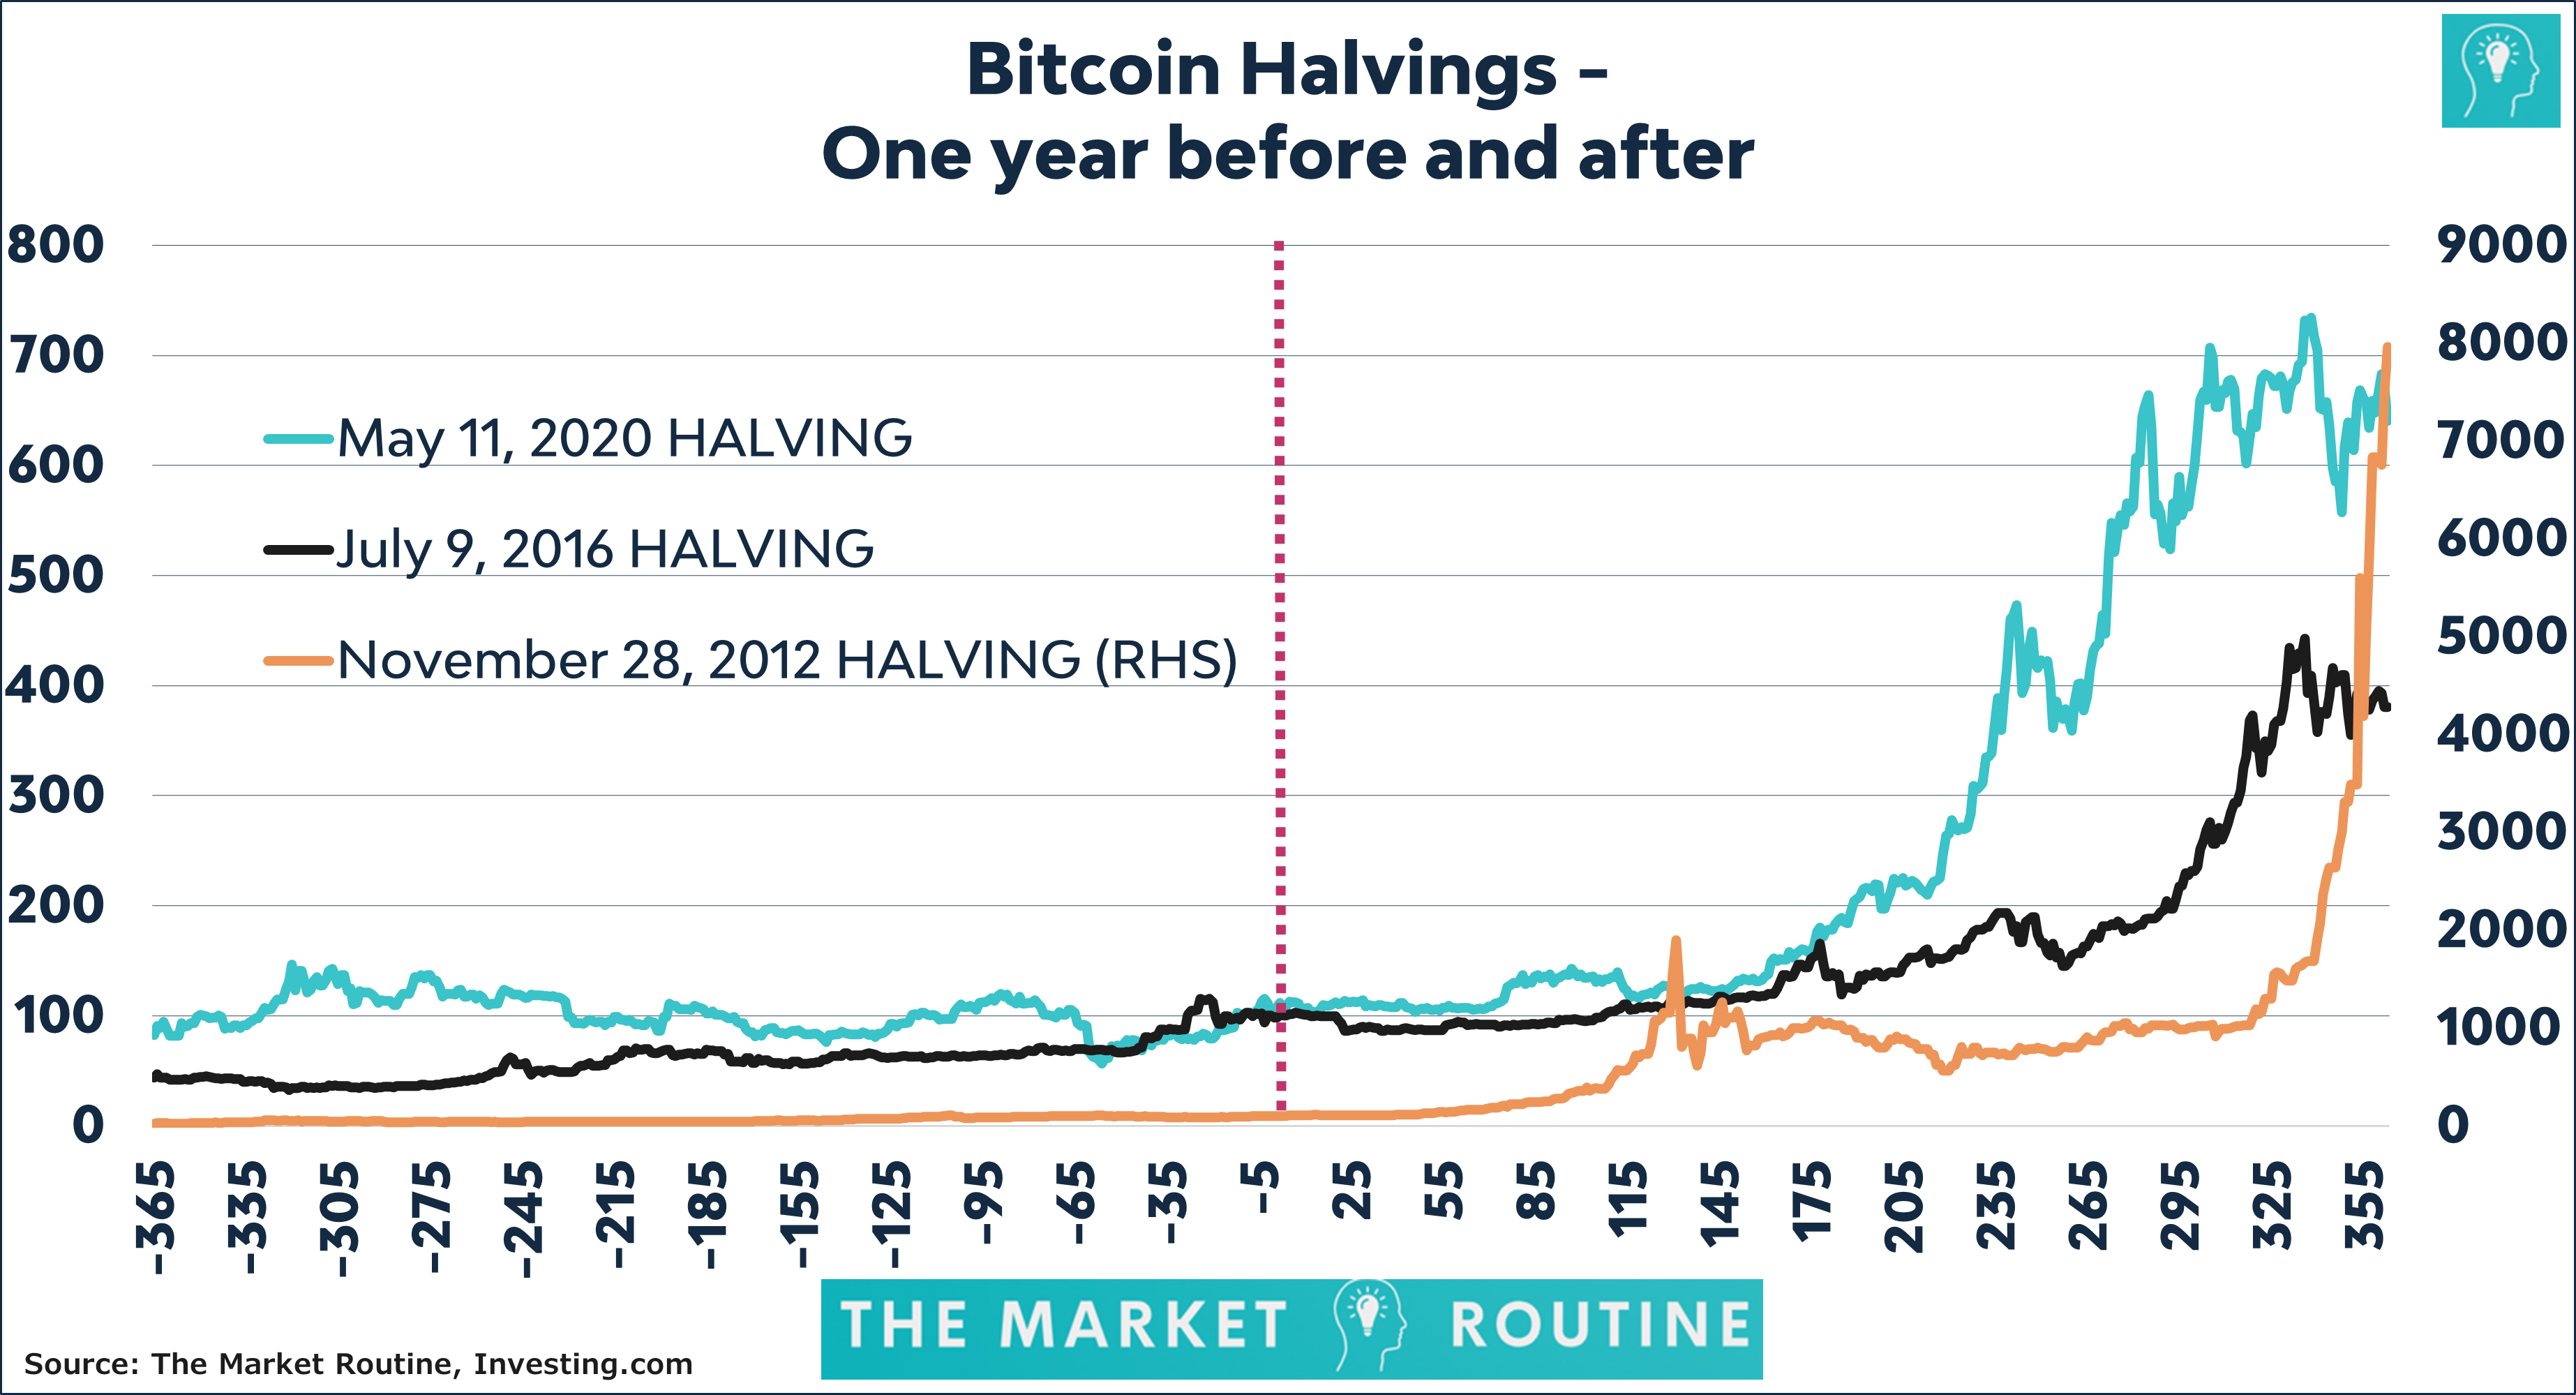
The key (and only possible) conclusion that can be made is that the lines in the chart run from the bottom left to the upper right. In all three observations, the price of Bitcoin rose in the twelve months leading up to the halving before surging even more aggressively in the twelve months that followed. After 2012, Bitcoin’s price spiked by an astonishing 7,863%, after 2016, 281%, and after 2020, 540%. As shown in the table below, there was only one period, the six months leading up to the last halving in 2020, during which Bitcoin’s price change was negative. Barely 1%.
What happened in 2012, 2016, and 2020?
To gain a sense of the overall market and economic conditions surrounding the previous Bitcoin halvings, I look at the developments within twelve months before and twelve months after the halving of the following market and economic indicators:
Bitcoin price in USD
10-year US Treasury yield
S&P 500 Index
NASDAQ Index
Gold price in USD
Oil price in USD
US Consumer Price Index
US GDP
Federal Reserve Target Rate
Fed Balance Sheet as % of US GDP
Except for the 10-year US Treasury yield and the Federal Reserve Target Rate, where I take the change in basis points, I calculate the change in percentage points twelve and six months before and six and twelve months after the halving date. The results are shown below:
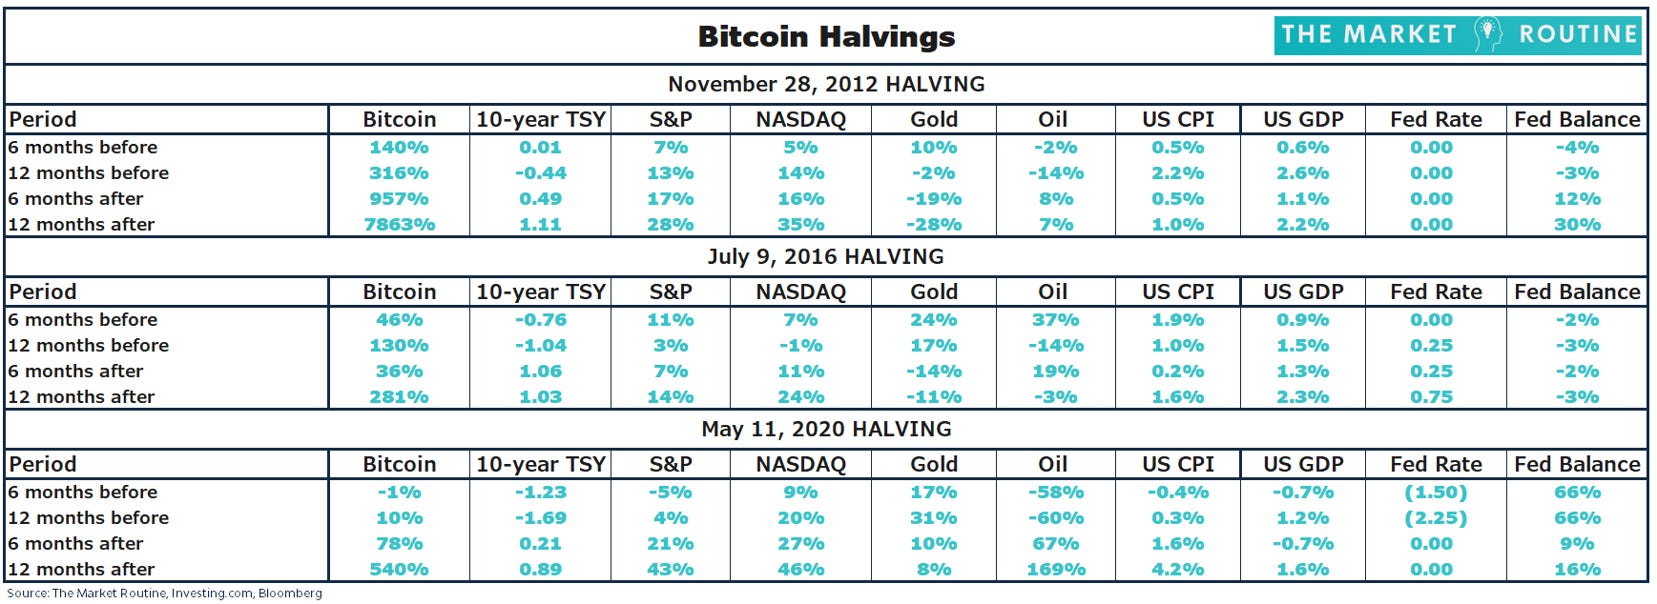
The second column shows the ‘Bitcoin returns,’ which I mentioned above. There are several noteworthy observations in anticipation of the upcoming halving scheduled for April 18, 2024:
In the six and twelve months leading up to the halving, bond yields generally declined, only to rise significantly after the halving.
This would mean that interest rates in the US would need to drop significantly in the remaining months to the halving, considering they stood at 3.60% on April 18 last year. In a scenario in which a recession suddenly emerges, and the Fed is forced to cut rates, parallels with previous halvings could emerge. However, time is limited, and it would require some very ugly macroeconomic figures in the coming weeks and months.
Although returns on the S&P 500 Index and NASDAQ were mixed in the run-up to the halvings, they were mostly positive. But the six and twelve months after, the halvings were characterized by stellar bull markets.
To avoid getting bogged down in an impossible comparison – how do you compare the aftermath of COVID with any other period – I’m only looking at the return numbers. Bitcoin’s strong price performance after the halving consistently occurred in a very favorable environment for risky assets.
Gold displays a mixed picture, with the only generalization being that the gold price tends to perform better in the run-up to the halving than afterward.
The twelve and six months surrounding the previous halvings are characterized by moderate to slow GDP growth. A 2.6% economic growth pace is the highest figure in the table.
Another period of moderate or low GDP growth around the upcoming halving seems highly likely. Due to higher bond yields, there is a significant chance that the US economy will grow below trend and may even enter a recession.
Except for the twelve months after May 11, 2020 – a period that marked the arrival of the highest inflation in four decades – the inflation picture was generally mild both before and after the previous halvings.
This indicates that Bitcoin performs well, not only when inflation is high. The correlation between Bitcoin and inflation is generally low, as is reflected in the table. The likelihood that the Bitcoin halving, or at least the period after it, will again be characterized by relatively low inflation is significant as economic activity dwindles.
In addition, the Bitcoin halvings occurred during periods of loose (2012) or looser (2020) monetary policy.
The exception may be the 2016 halving, although there was no major tightening cycle at that time either. And concerning the upcoming halving, this will again not be the case. Although the Fed Target Rate is 50 basis points higher than in April of last year, there is a very solid chance that interest rates will be significantly lower twelve months after the halving. While the changes in the Fed Target Rate will look different from previous halvings, overall policy will be skewed toward easing.
Supply as a Catalyst
The idea behind the halving is to ensure the scarcity of Bitcoin – and the associated inflationary dynamics. But what is also important – because the odds are high that we will see the approval of US spot Bitcoin ETFs before the next halving – is that the number of ‘available’ Bitcoins has drastically decreased.
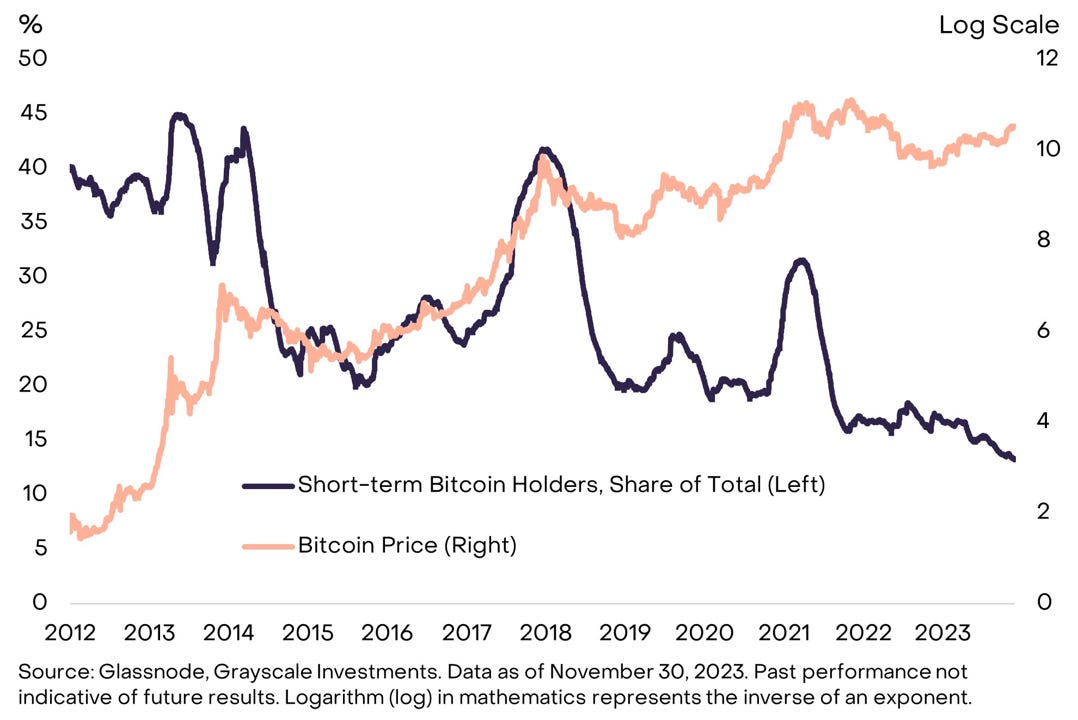
The chart below from Grayscale shows that Short-term Bitcoin (defined by Glassnode as Bitcoins held shorter than 155 days) holders as a percentage of total supply have reached their lowest level ever.
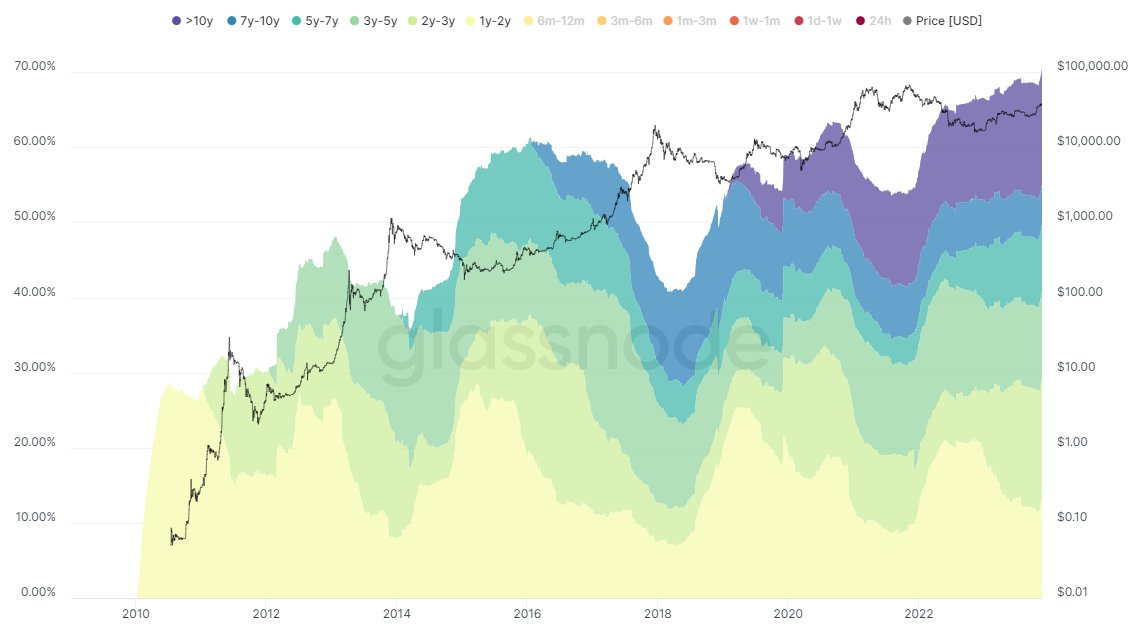
The next Glassnode chart shows the distribution of holding periods. What stands out is that the percentage of a holding period of more than ten years is steadily increasing. This cohort includes some early Bitcoin adopters, some of whom will have lost their Bitcoins. But the holding periods of five to seven and two to three years are also steadily increasing, both of which can be classified as long-term investors.
The relatively large and growing share of long-term investors means that the supply of Bitcoin will be relatively small when Bitcoin spot ETFs hit the market, likely early next year. In my earlier analysis of possible assets under management for spot Bitcoin ETFs, I estimated a range between USD 77 billion and USD 210 billion. This would represent an extreme demand-supply ratio. (Read my analysis here.)
Let’s assume my estimated assets under management will come entirely from short-term Bitcoin holders, who represent only 30% of the total Bitcoin supply, as the graph above shows. That 30% equates to nearly USD 250 billion based on Bitcoin’s current price and total market cap. This means that spot Bitcoin ETFs, according to my calculations, will account for 30% to 85% of the short-term available Bitcoins. That’s huge!
However, please note that these assets under management are long-term estimates. It will take (quite) some time for such AUMs to be realized, if they ever will be. Furthermore, the rising price of Bitcoin will increase supply, as more Bitcoin investors are willing to sell at these higher levels. Even El Salvador’s Bitcoins are now ‘in the money.’
However, it does not change the fact that if the ratio between long and short-term supply remains skewed, the approval of spot Bitcoin ETFs (you can expect a whole bunch to be approved by the SEC at once) will significantly impact the price of Bitcoin. Something at least some Bitcoin investors are front-running. But even if history repeats itself slightly, spot Bitcoin ETFs could act as catalysts for Bitcoin to break records surrounding the upcoming halving.
To be continued!
Jeroen